In a recent post, I explained the difference between a linear graph for non linear data and why it does not reflect the nuances shown in a non-linear (polynomial) model. In this post I will update the latest data (as of April 6) and see if the we can finally see a light at the end of this virus tunnel, hoping it isn’t a an oncoming train.
I have created four different models covering both national and Florida data for new Covid-19 cases and daily virus deaths. I have chosen new positive cases because this is where the whole process starts. No new cases equals no new future deaths over time.
Daily deaths will, of course, lag behind new cases but it in time the two variables should equal 0 (or near zero). There are, of course, a number of other markers such as new hospitalizations, but they will be highly correlated with new cases.
Let’s begin with the national data starting with daily new virus cases. Chart 1 displays the number of new cases (small circles) starting with the first confirmed cases and up to April 6.
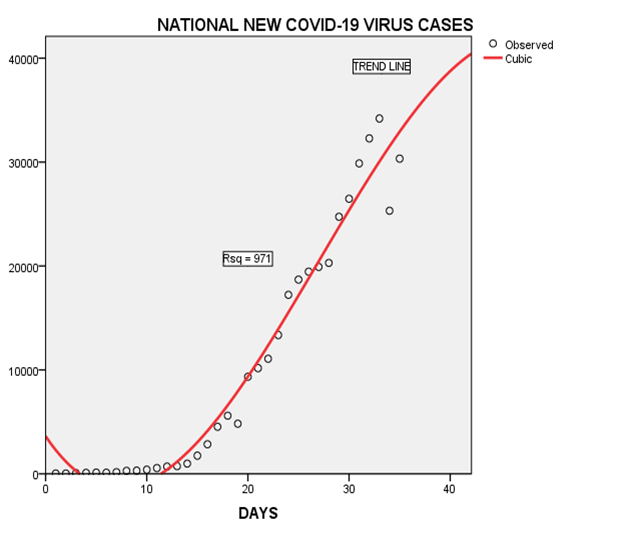
The red line is the model’s track of the new cases. Notice the track continues after the last case. This is the models estimate of how the next cases will trend, based on the previous new cases track.
As you can see, there appears to be the beginning of a curve. To emphasize: “it appears to...” New data could easily straighten the line and continue the track upward. now let’s look at what’s happening with national new daily deaths, as shown in Chart 2.
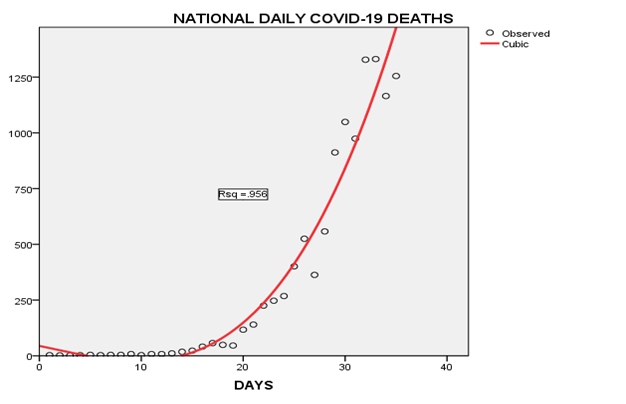
Unlike the new cases model, this one keeps the track on an upward pace, at least in the short term. Remember that deaths have a considerable lag time from new cases, so you wouldn’t expect a nascent curve as shown in the new cases chart. But at this point, I wouldn’t expect an significant changes until the number of new cases significantly slows down.
Now let’s look at how Florida compares to the nation. In Chart 3, we start with the number of new Covid-19 cases.
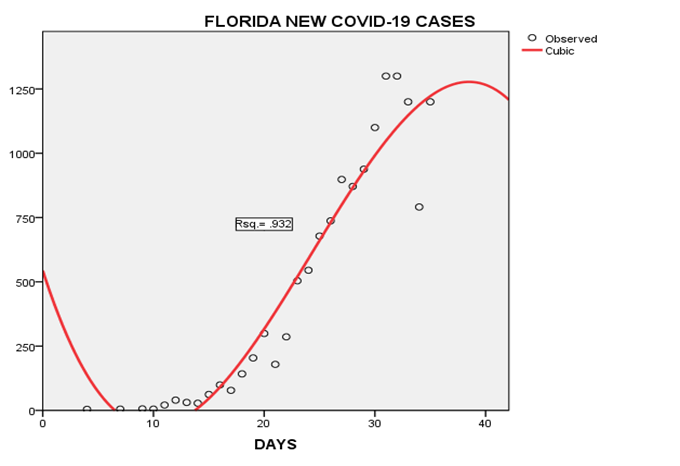
The Florida model shows a more defined curve projection than the national model. Again, this trend will depend on the next few days of new cases. For all of us Floridians going stir crazy, it at least gives some hope of an end to this confinement. Keep your fingers crossed…
Finally, we look at how Florida’s daily deaths are trending, realizing the significant lag time. Chart 4 displays the number of deaths on a daily basis.
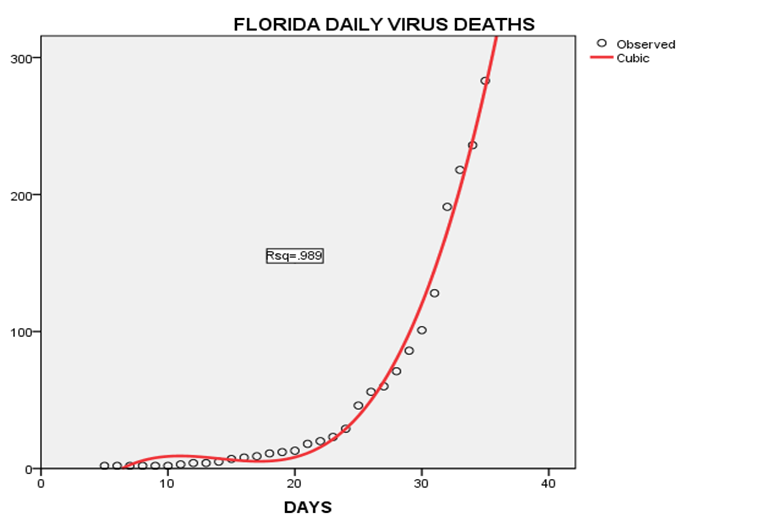
As we saw in the national daily-deaths, the Florida trend line is still moving upward and not slowing down yet. I wouldn’t expect any significant reduction in new deaths until we have a significant slowing down of new cases.
I will be updating these charts regularly, so keep checking in for the latest data. Be the first in your neighborhood to announce “it’s curving!”
Hopefully, this virus siege will slow down soon so we all can get back to our favorite bar. If they are still in business….