Political Scientists have long understood the political impact that party labels have on voters’ choice, even in Presidential Elections. I emphasize presidential elections because of the massive number of political TV ads, endorsements, news coverage and direct mail that voters receive during the campaign would suggest that campaigns have a major impact on the outcome. In 2020, the Trump and Biden combined campaign expenditures reached almost 15 billion dollars. (That is another record). Political Scientists have argued that partisanship is the dominant force in determining vote choice. (Campbell, Converse, Miller and Stokes, The American Voter, 1960[i]). Consultants, of course, would dispute such a claim.
Most people use voter registration as a measure of party identification, but this is not how political scientist’s see it. Most fundamentally, partisanship is an attitude, not a demographic. Public opinion researchers generally consider party affiliation to be a psychological identification with one of the two major political parties. It arises from early life learning experiences such as a person’s attachment to a religious denomination.
Children learn party identification through their parents. Research shows that partisanship is transmitted from your parents and by adolescence becomes engrained into the child’s socialization. It is often a subtle process where children hear family discussions about politics. But these parental cues pass on the party and political beliefs that often last a lifetime. Thus it structures a person’s view of the political world that affects all political issues. And vote choice in a presidential race is at the top of the list.
It is, however, not the same thing as party registration. Although most people will register in the same party as they identify with, it is not always universally the same as their party identification. In addition, not all states allow voters to register by party, and even in states that do, some people may be reluctant to publicly identify their politics by registering with a party, while others may feel they have to register with a party to participate in primaries that exclude unaffiliated voters.
The only way to accurately measure party identification is through a survey, where respondents are asked a series of questions that have been developed over the past 45 years. It is a sequence of branching questions that were developed by political scientists to classify an individual on a sevenfold continuum: strong Democrats, weak Democrats, independents closer to the Democrats, independents not closer to either party, independents closer to the Republicans, weak Republicans, and strong Republicans. Using this classification system, a researcher can estimate how an individual will likely vote. As you can imagine, this question takes time and, of course, costs more money. Consequently, party identification questions are usually asked only in academic surveys. (We include it in all our political surveys.)
In 2014, Pew Research conducted a survey on religious attitudes that included these party identification questions in all 50 states (including the District of Columbia). They then combined these results into three categories: Democrat, including leaners, Republican, including leaners and no party identity at all. Now these surveys occurred six years prior to the 2020 election, but this provides us with an additional variable: do the political effects of party identification fade over time.
The question for this post is how accurate voter identification is in predicting a presidential election, even six years prior to the election. Below, in Table 1, I list each state’s percentage of Democrats, Republicans and those with no affiliation derived from that 2014 Pew Survey.
Table 1
|
STATE | REP ID% | DEM ID% |
NEITHER% |
| Alabama | 52 | 35 | 13 |
| Alaska | 39 | 32 | 29 |
| Arizona | 40 | 39 | 21 |
| Arkansas | 46 | 38 | 16 |
| California | 30 | 49 | 21 |
| Colorado | 41 | 42 | 17 |
| Connecticut | 32 | 50 | 18 |
| Delaware | 29 | 55 | 17 |
| DC | 11 | 73 | 15 |
| Florida | 37 | 44 | 19 |
| Georgia | 41 | 41 | 18 |
| Hawaii | 28 | 51 | 20 |
| Idaho | 49 | 32 | 19 |
| Illinois | 33 | 48 | 19 |
| Indiana | 42 | 37 | 20 |
| Iowa | 41 | 40 | 19 |
| Kansas | 46 | 31 | 23 |
| Kentucky | 44 | 43 | 13 |
| Louisiana | 41 | 43 | 16 |
| Maine | 36 | 47 | 17 |
| Maryland | 31 | 55 | 14 |
| Massachusetts | 27 | 56 | 17 |
| Michigan | 34 | 47 | 19 |
| Minnesota | 39 | 46 | 15 |
| Mississippi | 44 | 42 |
14 |
| Missouri | 41 | 42 | 18 |
| Montana | 49 | 30 | 21 |
| Nebraska | 47 | 36 | 17 |
| Nevada | 37 | 46 | 18 |
| New Hampshire | 35 | 44 | 20 |
| New Jersey | 30 | 51 | 19 |
| New Mexico | 37 | 48 | 15 |
| New York | 28 | 53 | 19 |
| North Carolina | 41 | 43 | 17 |
| North Dakota | 50 | 33 | 18 |
| Ohio | 42 | 40 | 18 |
| Oklahoma | 45 | 40 | 15 |
| Oregon | 32 | 47 | 21 |
| Pennsylvania | 39 | 46 | 15 |
| Rhode Island | 30 | 48 | 22 |
| South Carolina | 43 | 39 | 18 |
| South Dakota | 53 | 37 | 10 |
| Tennessee | 48 | 36 | 15 |
| Texas | 39 | 40 | 21 |
| Utah | 54 | 30 | 16 |
| Vermont | 29 | 57 | 14 |
| Virginia | 43 | 39 | 18 |
| Washington | 33 | 44 | 23 |
| West Virginia | 43 | 41 | 16 |
| Wisconsin | 42 | 42 | 16 |
| Wyoming | 57 | 25 | 18 |
| Average % | 39.3 | 43 |
|
What is interesting is how close the Republican and Democrat party identifications are for the entire U.S. population. For the 50 states and the District of Columbia, the difference is only 3.7%, to the slight advantage of Democrats. This by itself explains why presidential elections outcomes are often so close.
In the 2020 election, Biden won the national popular vote by only 4.5%, less than a one percent difference than the average national party identification of the two parties from a survey conducted six years earlier. In the last two months of the 2020 campaign, the average of polls had Biden winning (Real Clear Politics) by 7%. Biden won the popular vote by 4.6%, while the average difference predicted by party identification from a survey taken six years earlier was 3.7%, a difference of only 0.9%. As you probably have heard, some presidential polls have been less than accurate in the last two cycles. This observation led me to explore whether using party ID is a better measure of an election outcome than polls taken just days before the election.

Statistically, we can measure through correlation analysis, the statistical impact of party identification on each state’s vote for President. Correlation analysis is a method of statistical evaluation used to study the strength of a relationship between two, numerically measured, continuous variables. This analysis is useful when a researcher wants to establish if there are possible connections between variables and how strong is that connection. A positive correlation result means that both variables increase in relation to each other, while a negative correlation means that as one variable decreases, the other increases. If there is a high correlation, we can estimate the final vote through a statistical analysis called linear regression. (For those who are statistically adverse …skip).
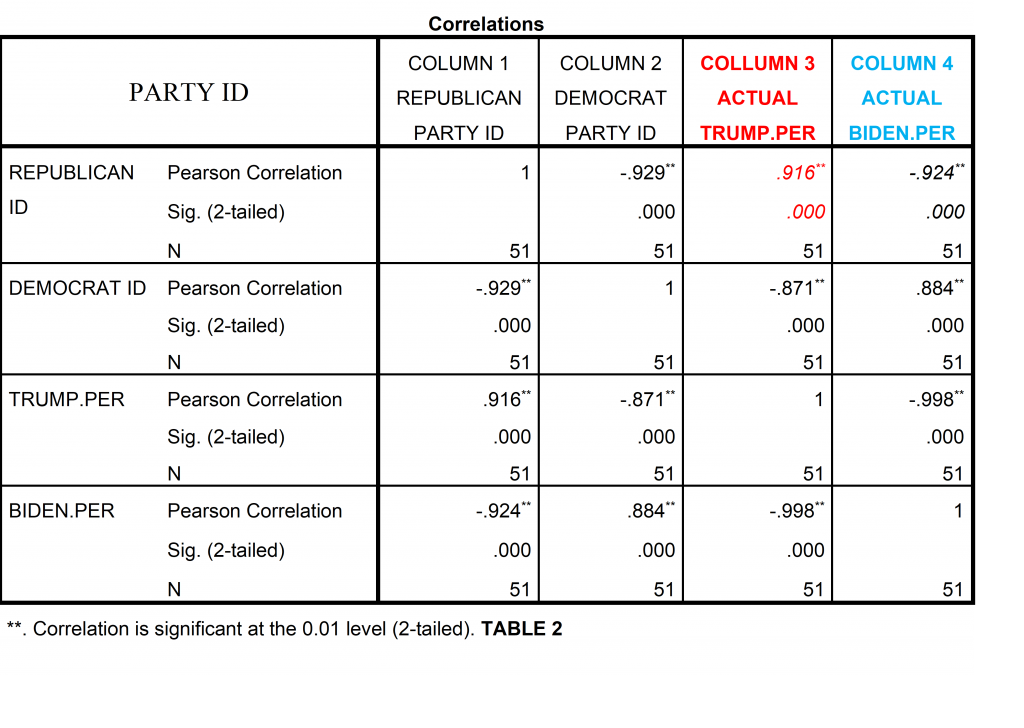
Table 2 above measures the statistical impact of the Republican and Democratic party id on people’s choice for President. Starting with the upper left of the Table, we have Republican Identified voters. Now look at column 3 In red, which shows voters with a Republican ID had strong positive relationship (.916, a 1 is a perfect match) with the actual percent of Trump’s percent of the vote, which means that as one variable increases, the other increases proportionally, at almost a one-to-one ratio.
Now look at the Democratic ID voters and their Biden (column 4 in blue) percent of the vote. Here we also find a strong positive relationship between Democratic identified voters and Biden’s percent of the vote (.884, <. oo1). Like the Republican ID voters, it is almost a perfect relationship.
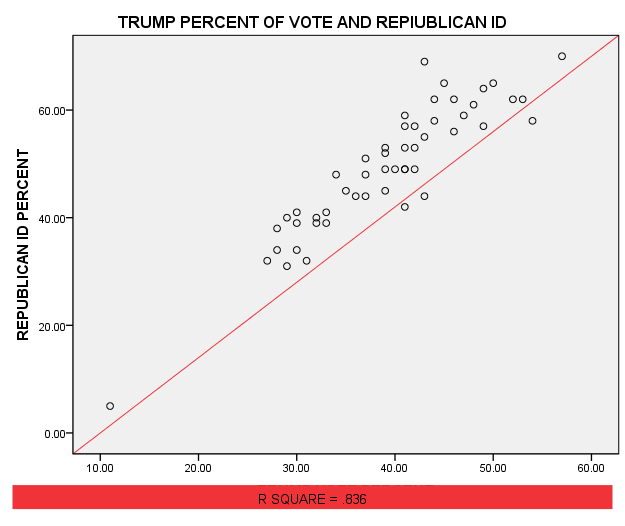
The chart above (Chart 1) shows a visual relationship of Republican Identification (percent) and the percent of Trump’s vote, which measures how well the model matches the data. Notice the upward slant of the red regression line. The small circles represent the individual states. In states like Wyoming and Utah, where Republican identification is above 60%, the Trump percent of the vote reached above 50%.
The model shows that as Republican Party Identification increases, Trump’s percentage of the vote increases in each state (R2 = .840). In statistics, an R square this high is rare, and it demonstrates the strength of voter identification on people’s vote. Remember that the data for Republican Identification is from a six-year-old survey.
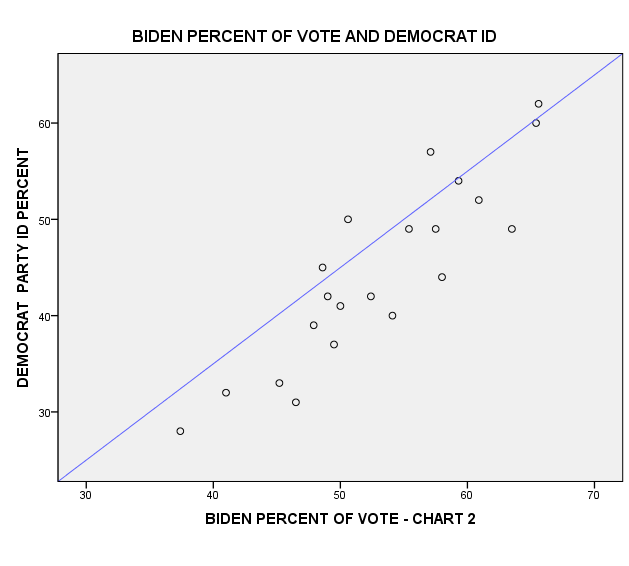
This partisan effect also occurs with Democrats as well. In Chart 2 (on the right), shows the linear relationship between Democratic Identifier’s and their choice for Biden. Again the small circles represent states and the vertical line the percent of Democratic identifiers.
This model estimates that increasing Democratic partisans by 100 increases his vote by 72. Adding 1000 more partisans increases his vote by 716. These are, of course, linear estimates.

Because this data was from a survey six years prior to the election, the campaign effects were nill. What this suggests is that Party identification is the primary indicator of vote choice for both Democrats and Republicans and a good predictor even in elections in the future. This observation buttresses the opinions of academics that campaigns are not as important as political consultants would have you believe. I would caution, however, that this analysis is based on a Presidential election, I would not yet draw the conclusion that it affects all campaigns such as local and state elections although it might.
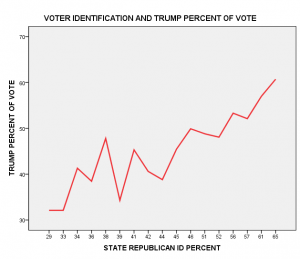
Perhaps a clearer picture of the relationship between voters’ partisanship and their vote is better shown in Chart 3 below, where it displays a line rather than dots showing an upward increase in Trump’s vote as the number of Republican Identifiers increases.
Notice, however, that the increase does not start out as linear, but bounces up and down until it reaches a least 44%. There is a similar pattern with Biden’s vote as well. This indicates that the sweat spot for a winning a state is at or around 45% party id or higher.
To test this observation that a state party id of 45% or higher is when a presidential candidate wins, I have taken Table 1 above and red lettered each state that Biden received 45% or higher. (CLICK ON LINK)
In every state that Democratic Party Identification reached 45% or higher, Biden won. In states that were almost tied in Party ID (like Arizona, Georgia, Wisconsin and Noth Carolina), they nearly split the popular vote in half. There are a couple of outliers such a Florida and Colorado. Remember that the survey was completed in 2014. In states that had a large increase in population, the estimates were less accurate. In Florida, for example, Republican Party registration increased by over 500,000 between 2017 and 2000 and Colorado is the second fastest growing state in the nation.
This exercise has confirmed what most political scientists have claimed in the past, that partisanship is the primary vehicle that people use to choose a presidential candidate. All the millions (now billions) of dollars spent trying to convince you who to vote for maybe for naught, except perhaps for the few true independent voters that still exist today. This observation, I know, is heretical to the hundreds of political consultants that provide presidential candidates with advice, strategies and persuasive commercials. But these campaign’s do provide one very important element: they mobilize their partisan base. In other words, voters party identification is awakened and mobilized by the commercials and direct mail pieces. And in a some cases, the few independent voters that still exist.
So can we use Party ID to predict future elections? From this analysis, it looks like the answer is yes. But…. there is a problem. We would need party id statistics for each of the 50 states. The fact that Pew Research added it to their Religion study to see how religious the two parties were in comparison to each other, was just an accident. As was my discovery of the data.
As a pollster myself, I can tell you how expensive a survey of 50 states of this type would cost. Consequently, it is unlikely that any private survey firm would undertake this project without financial support. That said, asking these questions in some individual states surveys is practical. For example, we all know the importance of so-called swing states in the Electoral College. In presidential years, surveys in these states are common and adding these Party ID questions is practical.
If my hypothesis is correct, we can now at least measure the partisan outcome of key swing states. Since the surveys would be closer to the election, the problems of population growth should be insignificant. And, of course, there is also the possibility that national survey firms, like Pew Research, would undertake a 50-state survey again, using the party ID questions.
I plan on doing a Florida gubernatorial survey using these party-id questions in the next state election cycle. This will allow us to see if the prediction value hold true at the state level in a non presidential election. So keep checking as we get closer to the Florida Governor’s race in 2022. Maybe we can make some money in betting markets. Be safe…
[i] Campbell, Converse, Miller and Stokes, The American Voter, 1960


