December 7, 2020
After every election, many political pundits conduct the inevitable election autopsy. For winners, it is more about taking credit for the win. For the losers, its not to take the blame at all. This post is neither. I’m just curious how Florida vote changed since 2016.
To understand Florida you need to look to the individual counties and not the state as a whole. That’s because Florida is several states on one narrow peninsula. The people living in Wakulla have as much in common with Broward voters as New Yorkers have with Birmingham, Alabama voters.
So to analyze Florida you need to look at each county and see if the state shifted to the right since Trump’s victory in 2016. Specifically, did all or only a few counties turned a brighter shade of red.
To do this we have to make sure we are not mixing apples with watermelons. The most obvious way is to compare each county’s total vote for either Trump or Clinton (2016) with the 2020 county vote for either Trump and Biden.
Although that seems sound, it would not be accurate because of each county’s population and registration changes during the past four years. More voters equals more votes. In Florida, the population changes each hour let alone in a four year period. In addition, some counties grow exponentially and others don’t change at all.
The solution is to calculate each candidate’s county percent of the two party vote. In other words, dropping the third party candidates from the analysis completely and comparting those percentages to the previous election. Using the two-party percentages acts as a control variable that is independent of the total vote.
On Florida’s 2020 ballot for example, there were five other candidates in addition to Trump and Biden. Although they didn’t accumulate a significant number of votes, combined they still walked away with over 100,000 votes.
Let’s start with how Donald Trump’s percentage of the vote change from 2016 to 2020, as shown in Table 1 below.
| COUNTY | TRUMP.2016 % | TRUMP.2020 % |
| Alachua | 36.4 | 35.7 |
| Baker | 81.5 | 84.7 |
| Bay | 71.1 | 72.1 |
| Bradford | 73.7 | 75.8 |
| Brevard | 57.8 | 57.6 |
| Broward | 31.4 | 35 |
| Calhoun | 76.6 | 80.8 |
| Charlotte | 62.5 | 62.9 |
| Citrus | 68.3 | 70.7 |
| Clay | 70.4 | 67.9 |
| Collier | 61.7 | 62.4 |
| Columbia | 71 | 72.2 |
| DeSoto | 62.7 | 65.7 |
| Dixie | 80.8 | 82.7 |
| Duval | 48.9 | 47.4 |
| Escambia | 58.3 | 56.7 |
| Flagler | 58.9 | 60.2 |
| Franklin | 68.6 | 68.3 |
| Gadsden | 30.4 | 31.4 |
| Gilchrist | 80.1 | 81.5 |
| Glades | 68.8 | 72.8 |
| Gulf | 73.1 | 74.9 |
| Hamilton | 63.1 | 65.4 |
| Hardee | 69.1 | 72.2 |
| Hendry | 55.7 | 61.1 |
| Hernando | 62.9 | 64.6 |
| Highlands | 64.7 | 66.8 |
| Hillsborough | 44.7 | 45.9 |
| Holmes | 87.9 | 89.1 |
| Indian River | 60.8 | 60.4 |
| Jackson | 67.8 | 69.1 |
| Jefferson | 51.4 | 53 |
| Lafayette | 82.8 | 85.5 |
| Lake | 60 | 59.5 |
| Lee | 58.7 | 59.2 |
| Leon | 35.4 | 35.3 |
| Levy | 71 | 72.4 |
| Liberty | 77.2 | 79.9 |
| Madison | 57 | 59.4 |
| Manatee | 57 | 57.6 |
| Marion | 61.7 | 62.5 |
| Martin | 62 | 61.9 |
| Miami-Dade | 34.1 | 46.1 |
| Monroe | 51.6 | 53.5 |
| Nassau | 73.5 | 72.4 |
| Okaloosa | 71.3 | 68.6 |
| Okeechobee | 68.5 | 71.9 |
| Orange | 35.4 | 37.9 |
| Osceola | 35.9 | 42.6 |
| Palm Beach | 41.1 | 43.3 |
| Pasco | 58.9 | 59.5 |
| Pinellas | 48.6 | 49.3 |
| Polk | 55.4 | 56.7 |
| Putnam | 66.9 | 70.2 |
| Santa Rosa | 74.5 | 72.4 |
| Sarasota | 54.3 | 54.8 |
| Seminole?? | 48.7 | 48.1 |
| St. Johns?? | 65 | 62.8 |
| St. Lucie | 49.9 | 50.4 |
| Sumter | 68.8 | 68.1 |
| Suwannee | 76.4 | 77.9 |
| Taylor | 74.6 | 76.5 |
| Union | 80.2 | 82.2 |
| Volusia | 54.8 | 56.5 |
| Wakulla | 68.5 | 69.9 |
| Walton | 76.6 | 75.4 |
| Washington | 77.4 | 80.8 |
| MEAN % | 62.01 | 63.40 |
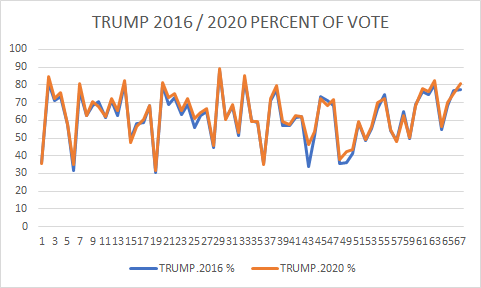
If you look closely, you will notice that there is very little change from the 2016 election. For all 67 counties, the average difference was only 1.39%! In 2016, Trump spent in Florida over $10 million for an increase of less 2%. Of course, he did win the state.
How similar the two time periods are graphically displayed in Chart 1 below, where the blue line shows the Trump 2016 percent and the red line 2020. In many parts the lines merge into one line showing that the percentages are identical.
Now let’s look at the Clinton/Biden Florida county differences, as shown in Table 2 below.
| CLINT.% 2016 | BIDEN.% 2020 | |
| Alachua | 59 | 62.9 |
| Baker | 16.7 | 14.6 |
| Bay | 24.9 | 27.5 |
| Bradford | 24.2 | 23.2 |
| Brevard | 38 | 41.2 |
| Broward | 66.5 | 64.6 |
| Calhoun | 20.4 | 18.7 |
| Charlotte | 34.7 | 36.3 |
| Citrus | 28.6 | 29.3 |
| Clay | 26.1 | 30.8 |
| Collier | 35.8 | 37.4 |
| Columbia | 26.5 | 27.2 |
| DeSoto | 35 | 33.6 |
| Dixie | 17.6 | 16.7 |
| Duval | 47.5 | 51.2 |
| Escambia | 37.7 | 41.6 |
| Flagler | 38.3 | 39.3 |
| Franklin | 29 | 30.9 |
| Gadsden | 67.9 | 67.9 |
| Gilchrist | 17.3 | 17.6 |
| Glades | 29.2 | 26.7 |
| Gulf | 23.6 | 24.3 |
| Hamilton | 34.9 | 33.7 |
| Hardee | 28.3 | 34 |
| Hendry | 41.5 | 38.1 |
| Hernando | 33.9 | 38.4 |
| Highlands | 32.7 | 34.8 |
| Hillsborough | 51.5 | 52.9 |
| Holmes | 10 | 10.2 |
| Indian River | 36.3 | 38.8 |
| Jackson | 30.4 | 39.1 |
| Jefferson | 46.3 | 46.1 |
| Lafayette | 15.3 | 13.9 |
| Lake | 36.9 | 39.5 |
| Lee | 38.3 | 40 |
| Leon | 60.5 | 63.5 |
| Levy | 26.3 | 26.8 |
| Liberty | 19.8 | 19.5 |
| Madison | 41.5 | 39.9 |
| Manatee | 39.8 | 41.5 |
| Marion | 35.5 | 36.6 |
| Martin | 35.2 | 37.4 |
| Miami-Dade | 63.7 | 53.4 |
| Monroe | 44.7 | 46 |
| Nassau | 23.3 | 26.5 |
| Okaloosa | 23.6 | 29.4 |
| Okeechobee | 29 | 27.5 |
| Orange | 59.8 | 61.1 |
| Osceola | 61 | 56.4 |
| Palm Beach | 56.6 | 56.1 |
| Pasco | 37.4 | 39.4 |
| Pinellas | 47.5 | 49.5 |
| Polk | 41.3 | 42.3 |
| Putnam | 30.5 | 28.9 |
| Santa Rosa | 21 | 25.8 |
| Sarasota | 42.7 | 44.4 |
| Seminole?? | 47.1 | 50.8 |
| St. Johns?? | 31.6 | 36.1 |
| St. Lucie | 47.5 | 48.9 |
| Sumter | 29.5 | 31.7 |
| Suwannee | 21.2 | 21.3 |
| Taylor | 23.2 | 22.7 |
| Union | 17.8 | 16.9 |
| Volusia | 41.8 | 42.9 |
| Wakulla | 28.3 | 29.1 |
| Walton | 20.4 | 23.7 |
| Washington | 20.3 | 19.2 |
| MEAN % | 35.07 | 35.7 |
Here I show the Clinton parentage results for 2016 when Hilary Clinton opposed Donald Trump in Florida. Alongside are the Biden percentages for each county in 2020. The average percentage difference between the two Democrats was only 0.63%. Biden’s campaign, after spending over $100 million, he increased Clinton’s percentage by less than one percent.
In a post a few months ago, I showed how more campaign money doesn’t increase the odds of victory in Presidential elections. http://thepoliticsdr.com/wp-admin/post.php?post=220&action=edit
This hypothesis is antithetical to campaign consultants. It all boils down to how you spend the money that matters. For Biden, his last minute bid to defeat Trump in Florida failed. More importantly, his increase over Clinton’s vote was still less than one percent.
In the end, however, this analysis demonstrates that Florida hasn’t yet turned a deeper shade of purple yet. In fact, it hasn’t significantly changed at all in four years and continues its valid claim to the title of the “swingiest state in the Union.” Be safe…