November 16, 2020
I’m sure you have heard or read that the Presidential Election polls screwed up again. Initially I was skeptical, of course, since 2016 almost all polling firms had made significant changes to their methodologies such as weighting voter education.
But after all the studies and soul searching, whatever changes that were made did not cure most if not all the errors, at least to Donald Trump’s share of the vote.
Using only swing states and not the national vote, I have compared the polling averages from surveys taken from polls conducted within the final 30 days prior to the election.
The states I analyzed are Florida, Georgia, Pennsylvania, Wisconsin, North Carolina, Arizona, Michigan and Ohio. No polls were excluded because of political bias or voter interview methods (live-interviews, online, or IVR, etc.).
I computed the absolute error between the polling averages and the actual state election results for both Biden and Trump. For example, if the final state result had Trump with 48% and the polling average at 46%, that would mean an error of 2%.
In the table below are the Trump and Biden absolute error rates for each state, starting with North Carolina, which had a Trump polling error of 2.3% and for Biden, 1.1%.
If you go down the list, all state polls except Florida, had Trump’s polling percent with greater error than for Biden. In all eight states, Trump’s average absolute error was 2.93% and Biden’s .062. All the state differences were statistically significant (T-Test).
| TRUMP | BIDEN | |
| STATE | ERROR | ERROR |
| N.CAROLINA | 2.3 | 1.1 |
| OHIO | 6.2 | -1.05 |
| PENNSYLVANIA | 1.6 | 1.1 |
| WISCONSIN | 5.1 | -1.4 |
| GEORGIA | 2.3 | 1.1 |
| MICHIGAN | 2.9 | 0.1 |
| ARIZONA | 2.6 | 0.4 |
| FLOIIDA | 0.4 | 3.6 |
| AVG. % ERROR | 2.93 | 0.062 |
The average error for all of these states for Trump’s share of the poll percent’s was a significant 2.9%. But for Biden it was only .062%. In other words, the polls consistently underestimated Trump’s vote by nearly three percent.
Random Error vs. Systematic Error
There is some error in every poll and there is nothing we can do to prevent it. Of course you can increase the sample size, but that can only reduce the error. Pollsters expect this, but they often pretend that polls properly conducted represent the future outcome. Polls are estimates and not absolute predictions.
And then there is systematic error. Before the survey begins, pollsters try to predict the turnout. Who votes and those who do not can alter that polling estimate regardless of statistical error. Overestimating or underestimating one group can have a significant effect on the final results. That is systematic error.
When I saw the Trump vote errors, I felt like Yogi Berra when he said “It’s like déjà vu all over again.”
So how did lightening strike twice in two elections. After 2016, the best minds in survey research came up with few potential errors:
1. Undecided voters broke for Mr. Trump in the final days of the race. But that didn’t happen this year according to exit polls and independent surveys.
2. Turnout among Mr. Trump’s supporters was somewhat higher than expected. No, that did not happen this time. Pollsters expected high turnout from both Biden and Trump voters.
3. Trump’s support in the decisive Rust Belt region, in part because those surveys did not adjust for the education. Not this time: Every major pollster adjusted for education in this election.
4. Some type of “shy Trump” voter bias was dismissed as unlikely.
What stands out to me is how the Biden poll estimate was right on the money, with an error rate of only .062%, which is about as perfect as it gets in surveys.
But the Trump voter error was almost 3%. This is undoubtedly a systematic error and not random. And this is the second Presidential election this has occurred.
The obvious answer to the failure of polls for the last two election cycles are with the responses of Trump voters. The average Biden poll percent of the vote was on the mark. All the error came from the responses of Trump supporters.
So let’s narrow down the search for the systematic error as to why Trump voters were underestimated when every other possibility has been eliminated.
We have eliminated previous possibilities, so that suggests that either Trump voters refused a polling interview, didn’t answer the phone or misled as to their real preference.
In the later case, this is a type social desirability effect called self-deceptive enhancement (SDE). SDE response bias is any systematic tendency to answer questionnaire items on some basis that interferes with accurate self-reports.
Self-deceptive enhancement bias is common in surveys on sensitive issues such as job performance surveys and sexual behavior. Pollsters have known this for decades. The cure for this bias in many cases is the application of computerized surveys.
But the issue of who you are voting for has never been considered sensitive enough to cause significant errors.
If self-deceptive effects are occurring, then we should see more accurate results from firms using Interactive Voice Recording (IVR) and online surveys, where the voter expresses their choice to a machine and not to a live person. This would be similar to a computerized survey when an honest/accurate response is important.
In my insatiable quest for truth in polling, I compiled a list of polling firms by their interview technique: live calls, IVR (robocalls) and online surveys listed on 538’s website.
Then I compared their interview method with the their last months Trump survey results and compared it to the final vote percent for Trump. (31 polling firms met this criteria). If there is no bias, we should see similar results from all three methods when compared to the actual vote.
My hypothesis is that the IVR and online polls were significantly (<.001 level) different than live caller polls and more accurate in Trump’s final vote. This would mean that Trump voters were not truthful in their responses to the live interviewers as compared to non-live caller interviews (IVR/online). In other words, the Trump shy-voter lives!
The results to this experiment were conclusive. As the chart below graphically demonstrates, live-interviewer polls have a significantly larger error rate for Trump supporters than either IVR or IVR/online polls, with an average error rate of 5.62% (red bar).
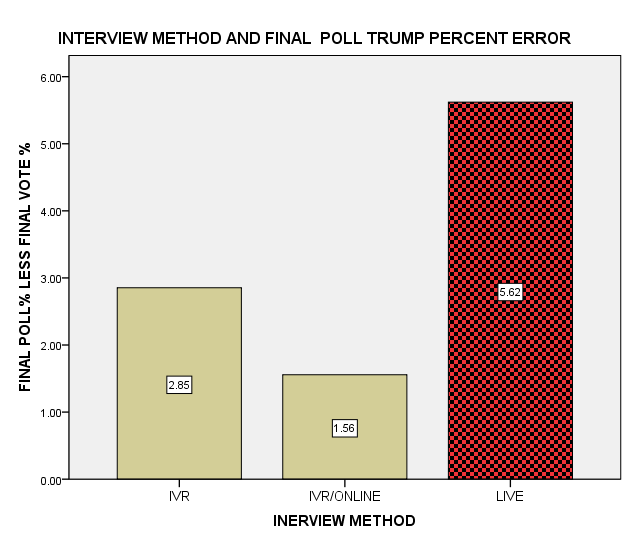
The survey method that was the most accurate on the Trump responses was the IVR/Online surveys, with an average error rate of only 1.6%. Next accurate was the IVR poll, with an error rate of 2.85%. Bringing up the rear, of course, are the respected and dominate forms of polling – the live-caller interviewer surveys with a 5.62% error rate!
The survey firms in this last category are the country’s most respected and considered the most accurate pollsters in the country. You know who I’m talking about.
I’m not going to criticize these major firms since I quite frankly didn’t believe that social desirability effects were causing these survey errors either until I looked at the data.
But in hindsight, I should have considered it. After all, Donald Trump considers the Proud Boys as a socially acceptable group. For many Republican voters, this is probably not an acceptable opinion (along with many others he has espoused). Consequently, when talking to a live-interviewer, they made a small fib, even though they planned to vote for Trump.
This insight, if used in Presidential election surveys where one of the candidates has opinions that are outside the mainstream, such as Donald Trump running again in 2024, should cure this problem.
Let me hear from you on what you think. I could use your comments. Be safe…