October 19, 2020
Conventional wisdom has a higher turnout benefits the Democratic Party. This conclusion is mostly based on the majority party having a large population of lower social economic status (SES) voters, thus decreasing their participation rate on election day.
But in a Presidential Election, the turnout rate is always higher and conceptionally, should benefit the Democratic candidate, everything else being equal.
Another problem with this question is what is a non-voter? For some studies this means someone who is eligible to vote, but doesn’t. That’s in contrast to those registered to vote but doesn’t vote.
For purposes of keeping a level research field, I prefer measuring turnout based on those already registered to vote and not the voter eligible population.
And since we don’t know what the turn-out will be on November 3, I will use data from the 2016 Florida Presidential Election to create a model to estimate what affect it could have on Biden’s percent of the two party vote, while controlling for other variables.
In political science, this requires the application of a statistical method called multiple regression. This method allows for determining the specific effect of one variable while controlling for the effects of other variables in the equation. Specifically, how a one percent increase in turnout affects, if at all, Biden’s percent of the total vote.
This sounds technical and it is, but I will attempt to plainly explain this process as simply as I can. I have taught this to my graduate students for many years and occasionally, some students understand it. But don’t worry, the bottom line: does the model work as an estimate of turnout.
I’m using the county level data from all 67 counties in the 2016 Florida Presidential election. This data file contains approximately 45 different variables that might have some impact on turnout. You cannot go out and find all of this data in one place, because I have personally collected this data from many many different sources.*
Chart 1 below, shows the model’s accuracy estimate. The most important number is the R Square value, which is .901. This means that the model explains 90% of variance in the prediction value. In the social sciences, this is about the highest level you can get from a regression model.
| BASIC STATISTICS | ||||
| R | R Square | Adjusted R Square | Std. Error of the Estimate | Durbin-Watson |
| .949 | .901 | .894 | 4.40508 | 1.898 |
Table 2 below, is the most important table of the group. It includes the statistical significance of each of the variables in the equation. The significance level (sometimes called the P-Value) tells us if the variable has a statistical effect on the dependent variable, which in this case is Clinton’s turnout percent. Remember, I’m using the Clinton data to estimate the affect on Biden’s percent of the vote.
| Coefficients Table | ||||
| Model | Unstandardized Coefficients | Standardized Coefficients | t | Significance |
| B | Std. Error | Beta | ||
| (Constant) | 133.006 | 9.201 | ||
| REPUB.PER | -1.934 | .103 | -1.466 | .000 |
| DEM.PERCENT | -1.199 | .120 | -.925 | .000 |
| TURN.PER.2016 | .308 | .137 | .102 | .029 |
| BLACK.PERCENT | .457 | .083 | .319 | .000 |
Acceptable significance levels are from .000 to .05. All but the turnout percent in 2016 is at the highest level. But even the 2016 turnout percent is at the acceptable level of .05. I have eliminated all other variables that don’t closely reach these levels.
In Chart 1, I show a scatterplot of the model’s estimate on the affect on Hilary Clinton’s turnout percent based on the models estimates.
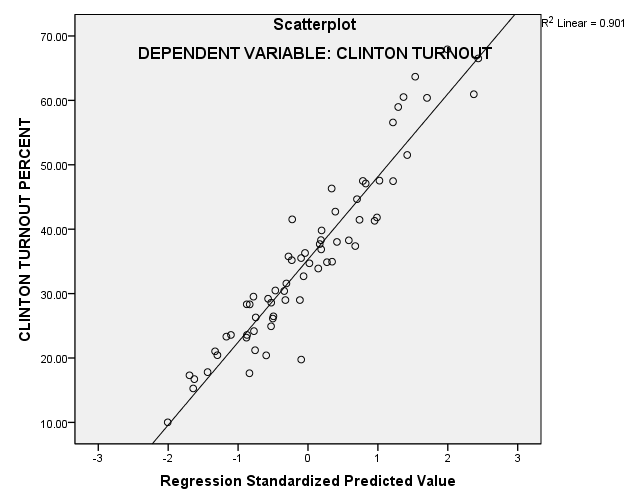
As you can see, the model shows a strong linear relationship on her turnout percent in every Florida County (small circles) in 2016.
Now we can use this models unstandardized coefficient (.308) located in Table 2 of the 2016 turnout percent (TURN.PER.2016).
An unstandardized coefficient represents the amount of change in the dependent variable Y (percent of Biden’s vote) due to a change of 1 percent of independent variable (turnout) in 2020, while controlling for the effects of the other variables in equation.
Specifically, I have controlled for the Republican registration, Democratic registration and the Black registration in each of the 67 counites, so we can see the singular effect of voter turnout alone.
While controlling these variables, if the turnout in Florida increases by 5% over the 2016 turnout (80%), Biden’s share of the two party vote increases by 1.5% percent (5 x .308). If, however, Florida hits the record turnout of 83% in 1992, Biden’s percent of the vote increases by 2.5% (8 x .308).
The increase doesn’t seem major, but we have to remember Florida’s habit of elections that are traditionally razer thin. In 2016, Donald Trump only won Florida by 1.2 %. Theoretically, a 4.5% increase in the turnout would have given Hillary the Florida win. But Trump would still have won the national election with a electoral count of 275 votes even while still losing Florida.
As a caveat, this an estimate derived from one specific campaign. But the model does confirm that in Florida, increasing the total turnout of registered voters does benefit the Democratic candidate. Which confirms the assumption of conventual wisdom. But the effect is small… Be safe…
* For those who want a copy of the data file, you will need SPSS software to use it. Just put a note in the comment section with your email.