August 1, 2020
When I was growing up, the Party Conventions decided the nominee through a series of votes by delegates who were wheeling and dealing for influence. It was a pageant that would put any of today’s reality shows to shame.
I remember watching it with my father on a black and white TV, staying up longer than my mother would normally allow. It was both a spectacle and an education for a young boy watching delegates cutting deals with each other on live television. I loved it.
But that was a long time ago, and modern conventions now provide a platform to introduce their nominee, already decided by party-primary voters, before a national TV audience covered in a rally like demonstration of party unity, balloons and all.
But the conventions still provide a significant function by writing platforms, introducing the vice-presidential nominee and showing party unity after a sometimes contentious primary campaign. If successful, the warring candidates and their supporters, end up hugging each other and that maybe it’s most important contribution to the party’s nominee’s success, as Clinton’s campaign discovered in their 2016 Convention.
But what maybe the most important aspect of a successful convention is what academics and political observers call the “the Convention bounce.” This is the increase in the nominee’s polling numbers following the convention.
Previous studies on a convention’s impact before 1988, have shown that the difference between trial heat polls prior to the convention and after are typically around 6%. (The Convention Bump, American Politics Quarterly, July 1992).
But Covid-19 has changed the rules for this year’s conventions. No longer will a wild and enthusiastic crowd waving signs, festooned with descending balloons broadcast on national TV, and interrupted occasionally by celebrities and party leaders.
Instead, the plan for the Democrats is to conduct a “virtual convention,” which means the state delegates will be voting from their homes for the already decided nominee, Joe Biden. No pageantry and no balloons. Joe Biden will make an acceptance speech in Milwaukee, but not in front of screaming delegates acting like teenage girls as if Joe was Justin Bieber. (I will miss this part.)
Donald Trump has given up on his Party’s convention in Jacksonville due the out of control virus in Florida. He says he will accept the nomination back in Raleigh, North Carolina, after pulling out of that state because of pandemic restrictions (masks?). The details are still, at this point, a little murky but I’m sure it will be broadcast on national television.
But these changes provide an opportunity to see if the pageantry of the previous party conventions really make a difference in the degree of a ” convention bump.”
But first we need to see how previous conventions effected their party’s nominee in the trial heat polls. Below is a table of how previous conventions effected the presidential candidates from 1980 through 2016.
| YEAR | DEM.% GAIN | REP.% GAIN | WINNER |
| 1980 | 2 | 5 | REP |
| 1984 | 3 | 6 | REP |
| 1988 | 7 | 7 | REP |
| 1992 | 17 | 0 | DEM |
| 1994 | 5 | 8 | DEM |
| 1996 | 8 | 5 | REP |
| 2000 | 0 | 4 | REP |
| 2008 | 5 | 2 | DEM |
| 2012 | 3 | 4 | DEM |
| 2016 | 2 | 2 | REP |
| AVG | 5.2 | 4.3 |
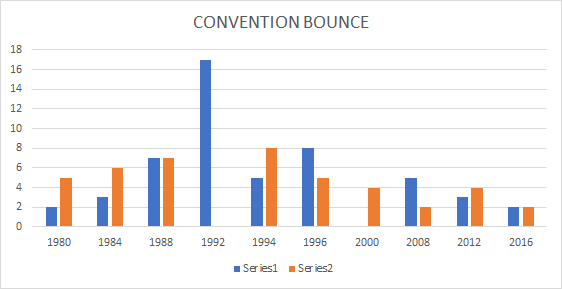
This table and chart shows the percent change in the party’s nominee’s trial heat polls in the Gallup survey two weeks prior to the convention as compared to the first Gallup poll after the convention. For example, in 1980, the Democratic candidate, Jimmy Carter, gained 2% in the post convention poll (a 2% bump). Ronald Reagan had a gain of 5% between his prior convention poll and the post convention poll (a 5% bump).
In 1992, Bill Clinton made his first campaign for president against incumbent President H. W. Bush. In the month before the convention, his polling share of the averaged 25%.
He was practically an unknown until the convention, but he was charismatic and he could “feel your pain.” When the dust settled after that convention his percent of the two party vote went from 40% to 57%!
The final column lists the party winner in each campaign. In our 1980 example, the winner indicates the Republican party nominee the winner (Ronald Reagan).
The average convention bump for all 10 election cycles for Democratic candidates was 5.2% and for Republican candidates 4.3%. No candidate in this time period had a negative result and two candidates had a net gain of zero.
Out of the ten election conventions, the candidate with the largest poll increase won six elections, suggesting that a positive convention develops some momentum.
In 2016, Hilary Clinton and Donald Trump had identical convention bumps of 2%, which may have foretold a close election.
Now that we have examples of previous “convention bumps” we can measure the changes caused by an abbreviated convention format.
If after the convention the bump is still within the average of previous election cycles, we can conclude that the changes had no effect on the election bump. If, however, it is significantly lower than previous conventions, we can conclude that having a more traditional convention is politically advantageous.
We will have to wait for the two conventions before we can calculate the impact. I don’t know about you, but I’m betting on a convention dud. Be safe…