July 16, 2020
I’m sure by now you have heard how Biden is extending his lead in the latest polls. The media has blasted that headline on every website and newspaper in the country. Although Bloomberg’s headline is correct, it’s not the whole story, which I think is even more interesting.
In the Chart below, we see how Biden’s net lead over Trump has increased over the past seven months.
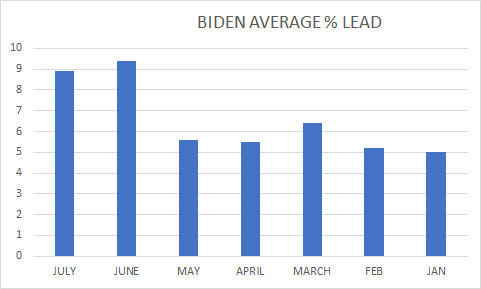
Each bar represents the monthly average of all public polls with the trail ballot question between Biden and Trump. In January, Biden’s lead was 5%. By June it had increased to 12%. Statistically, that’s an 82% increase in six months.
Now let’s look at Biden’s and Trump’s share of the two party vote in the same time period in the chart below.
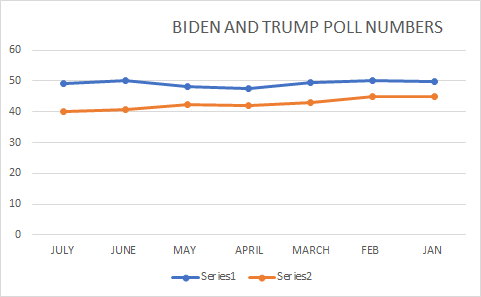
Biden’s average percent in January was 49.8%% and his average in July was 49%, a 0.8% difference in seven months. Yet his average lead over Trump increased to 12%. In the chart above, notice the blue line (Biden) moves steadily along the 49% line, and takes only minor deviations from that line.
So how did Biden’s lead increase to 12%? The answer is that his numbers didn’t change but Trump’s declined, increasing Biden’s net gain even though his share of the vote hardly changed at all. In other words, there are not more for votes for Biden but less for Trump.
So where did all those votes go? They go where all voters go when they can’t make a decision: the undecided/don’t know category.
What does that mean? Simply put, these votes are now up for grabs by either candidate, but I would rather be Biden than Trump at this point. Some of these voters may not vote at all, which means they are contributing to Biden’s victory anyway.
If you are a Biden supporter, don’t go out and party just yet (bars are closed anyway). There are the Conventions and debates still ahead. Research suggests that many voters don’t start making up there mind until after labor day. The finish line is still a ways to go…Be safe.