July 6, 2020
I was just beginning my survey career in the 1980’s, just as pollsters were transitioning from in-person interviews to telephone surveys. Gallup finally gave up the in-person survey in 1988, marking the end of public polls using in-person surveys.
Today the new kid on the block is the online poll where interviews are conducted through the internet via computers and cell phones. This change has blossomed for a number of reasons, the most important is cost. A telephone survey is far more expensive to conduct.
The other problem is the response rate, which is the percentage of people who complete a telephone poll. Today that rate has dropped to 6% of voters. This has led some national firms, like Pew Research, to shift most of its surveys to an online format.
But there are downsides to this change. The most important is the lack of randomness that telephone surveys enjoy. The key issue for any poll is that every respondent has an equal probability of being selected and interviewed. Probability Theory mandates that randomness is necessary to make mathematical assumptions as to the reliability of the poll. In other words, whether we have confidence in the results based on expected error.
Opt-in polls are self-selecting and are not random, consequently the results are not testable. That doesn’t mean the results are wrong, but it does mean you cannot use probability theory to estimate the potential error. Some major survey firms that use online polls, compensate for this by using national panels of voters that are recruited via probability methods like the American Trends Panel.
Even with these issues, most national surveys have switched to online polls. The ultimate question is how different are they from live-caller surveys? To analyse this, I have adopted a method called an observational study which does not require the randomization the subjects involved. This is often used in medical, economic and political studies where the randomization of participants is not possible.
In June, most polls started to show Joe Biden expanding his lead over Donald Trump in national and state polls. Taking the results of all surveys conducted in June, I selected national polls using two different survey methods: online and live caller interviews that occurred within two days of each other. The object was to measure if the results of the two methods resulted in significantly different results.
In June there were 10 live-caller surveys and 10 online only surveys. In both mode types, Biden led in every poll ranging from seven percent to fourteen percent. As shown in Table 1 below, the number in each column is the percentage lead Biden had in each survey mode.
| ONLINE % | LIVE CALLS % |
| 9 | 12 |
| 8 | 12 |
| 8 | 8 |
| 4 | 14 |
| 8 | 12 |
| 9 | 8 |
| 9 | 14 |
| 10 | 7 |
| 8 | 7 |
| 10 | 11 |
The average percent lead for Biden in the online polls is 8.3%. In the live-caller polls, it is 10.5% or a difference of 2.2%. In the chart below, we see a graphic representation of the both poll methods.
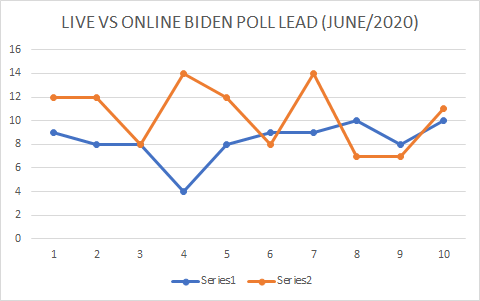
The red line shows the live-caller poll’s percent lead for Biden and the blue line the online-poll percent lead for Biden. Although some results showed both polls with similar outcomes, overall it is apparent that Biden in general has a small lead among live caller surveys. But is there a statistical difference in the two modes?
Using a simple student T-Test, we can confirm if the differences are significant or just a random occurrence.
| One-Sample Test | ||||||
| Test Value = 0 | ||||||
| MODE TYPE | Sig. (2-tailed) | 95% Confidence Interval of the Difference | ||||
| ONLINE | .000 | . | ||||
| LIVE | .000 |
As shown in Table 2, the differences are significant (Sig. level =.000) is less than .05, so we have confidence that the two modes are significantly different from each other.
So we have two types of surveys, one group using live callers from a randomized list and another group from online surveys with opt-in panels taken in the same time frame. Both sets show Biden in the lead but the online surveys show the lead significantly less than the live-interviews surveys.
In 2016, there was a similar pattern that showed non-live interviewer polls narrowing the gap after June between Trump and Clinton, but still showing Clinton leading. In the end, the online surveys in many battleground states had the race closer but with Clinton still losing.
Non-live interview firms have always asserted that some voters are more honest about their voting intentions when responding to either an online or IVR (robocall) poll.
This would usually be attributable to what political scientists call social-desirability effects, that is when a voter gives an answer that is considered more acceptable even though they don’t believe in it, when they are talking to a real person. And the online survey mode may give some Trump voters more courage to respond truthfully, since there is no live interviewer.
So what is a poll watcher to do? My advice is to average all the polls for that period and ignore the poll mode. It won’t guarantee the actual results are correct, but it increases the number of surveys and, of course, the total respondents. The “law of large numbers” can increase the accuracy. More on this in a future post. Be safe…