June 18, 2020
In my search for new data sources, I discovered a series of polls that included what pollsters call “favorability ratings” prior to and after the 2016 Presidential Election. As a pollster, I have used the favorable ratings in almost every political survey. It is a non-presidential candidate version of the job approval rating. It’s a simple question that usually gives two options: favorable or unfavorable.
Gallup used this question for Donald Trump in the months leading up to his 2016 election. As you may recall, some of the 2016 state polls had some significant errors that led to analysts to underestimate the Electoral College, but the national polls were generally accurate with the Real Clear Politics average prior to the election was 48.2% Clinton and 46.1% Trump. The final results were exactly the same.
Since these favorable ratings are from national voters, I consider them reasonably reliable. The chart below is graphic representation of Trump’s favorable rating from May through December, one month after the election.
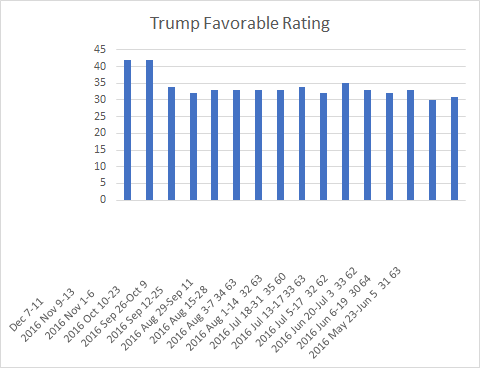
The dates above should read from right to left. The data for this graph and the corresponding dates are listed below in Table 1.
| DATE | FAVOR | UNFAVOR | POLL TRUMP |
| Dec 7-11 | 42 | 55 | N/A |
| 2016 Nov 9-13 | 42 | 55 | 45 |
| 2016 Nov 1-6 | 34 | 62 | 44 |
| 2016 Oct 10-23 | 32 | 65 | 45 |
| 2016 Sep 26-Oct 9 | 33 | 63 | 44 |
| 2016 Sep 12-25 | 33 | 62 | 42 |
| 2016 Aug 29-Sep 11 | 33 | 62 | 42 |
| 2016 Aug 15-28 | 33 | 62 | 41 |
| 2016 Aug 3-7 34 63 | 34 | 63 | 41 |
| 2016 Aug 1-14 32 63 | 32 | 63 | 42 |
| 2016 Jul 18-31 35 60 | 35 | 60 | 41 |
| 2016 Jul 13-17 33 63 | 33 | 63 | 41 |
| 2016 Jul 5-17 32 62 | 32 | 62 | 40 |
| 2016 Jun 20-Jul 3 33 62 | 33 | 62 | 38 |
| 2016 Jun 6-19 30 64 | 30 | 64 | 34 |
| 2016 May 23-Jun 5 31 63 | 31 | 63 | 32 |
There are two points to notice in this series of Trump favorable and poll numbers. First, his unfavorable rating never dropped below 60% during the last seven months of the campaign, until he was elected.
Secondly, notice how consistent his favorable ratings are, while his percent of the polling vote increases. There is no significant correlation between the two variables, which suggests that liking or disliking a candidate does not seem to effect their vote choice, by itself.
With unfavorable ratings this high, you are probably wondering how Trump managed to lose the national vote by only 2%. Well if you do, you forgot about the other candidate: Hilary Clinton.
When you compare her favorable/unfavorable ratings, the choice is a little clearer. It turns out that both candidates are upside down when you subtract their unfavorable ratings from their favorable ratings (net rating), as shown in the chart below.
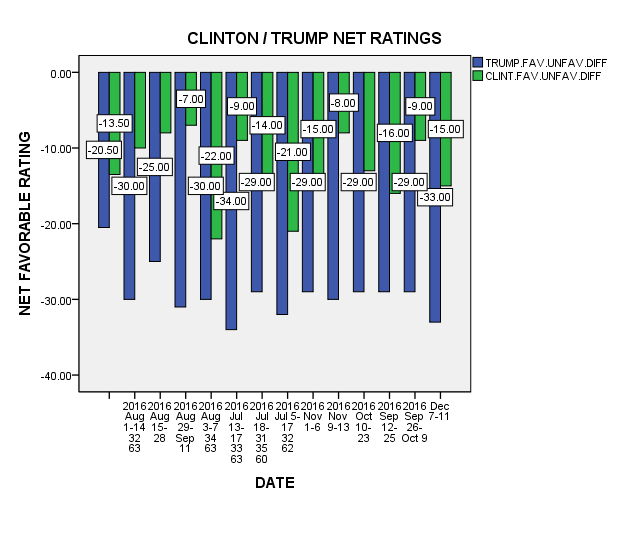
The blue bars are Trump’s net (negative) ratings and the green, Clinton’s net (negative) ratings. On average, Trump net favorable rating is a -29%. Clinton’s has a net favorable of -13%. In other words, Clinton has a positive 16% favorable difference when compared to Donald Trump. This is the classic “lesser of two evils” scenario. And Clinton wins.
So how does Biden’s ratings stack up against Donald Trump? You probably got a clue from this posts title. Yes, Donald Trump has never been popular. In the Table below shows both candidates favorable and unfavorable ratings, as well as their net favorable ratings.
TRUMP BIDEN
| DATES | FAV | UNFAV | NET DIFF | FAV2 | UNFAV3 | NET DIFF |
| 6/13 – 6/16 | 43 | 56 | -13 | 53 | 44 | 9 |
| 6/14 – 6/16 | 42 | 57 | -15 | 48 | 50 | -2 |
| 6/11 – 6/15 | 40 | 56 | -16 | 42 | 46 | -4 |
| 6/12 – 6/14 | 40 | 56 | -16 | 41 | 50 | -9 |
| 6/12 – 6/14 | 41 | 54 | -13 | 44 | 48 | -4 |
| 6/2 – 6/3 | 40 | 52 | -12 | 45 | 37 | 8 |
| 5/28 – 6/2 | 40 | 53 | -13 | 37 | 38 | -1 |
| 5/28 – 6/1 | 38 | 57 | -19 | 42 | 49 | -7 |
| 5/25 – 5/28 | 42 | 56 | -14 | 46 | 51 | -5 |
| 5/13 – 5/14 | 43 | 52 | -9 | 47 | 44 | 3 |
| 5/7 – 5/10 | 45 | 54 | -9 | 45 | 50 | -5 |
Trump’s average net rating is -13.5% and Biden -1.5%, a net difference of 12% in Biden’s favor. So if the favorable ratings were the only reason for voting for president, Biden at this point would win. The Chart below graphically shows the two candidate’s relative favorable positions.
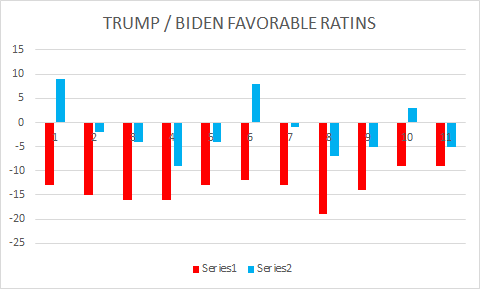
The Blue bars represent Biden’s ratings and the red, Trump. As you can see, Trump’s ratings have all been negative, but Biden has three periods where his ratings were positive. And, of course, his negatives are far less than Trump’s.
It is not unusual for public officials to have negative ratings and that is particularly true of presidential candidates. Partisanship differences color most of our evaluations. That’s why I’m a little surprised that Biden had any positive ratings at all.
More importantly, this series shows that Trump has never been liked, even on the day he was elected. On that day, 62% of voters had unfavorable opinion of him. The next day, some people changed their minds, but most still didn’t like him. As I tell my children, vote even if you have to hold your nose…