June 12, 2020
“Mr. Biden leads the President by around 10 percentage points in an average of recent of live-interview telephone surveys of registered voters.” The Upshot
I get the New York Times delivered everyday. It’s my morning coffee time and I look forward it. I’ve always considered the “Times” well researched and written. It does have a political slant, of course, but that doesn’t bother me. (I have my own biases.)
In yesterday’s paper, I noticed an article on how Trump’s numbers were “eroding” and that it was an indication of how the pandemic, economy and demonstrations were having a toll on his re-election chances.
The article contained a chart displaying six major polling firms and the increase in Biden’s percent lead against Trump from the same firm done earlier in the spring. Unfortunately, the article didn’t identify the earlier dates made in the comparison.
For instance, they cite a Monmouth poll showing a 7.5% increase in Biden’s lead, but the only two Monmouth polls listed in this time period had only a 1% percent difference.
The same was true of the ABC/Washington Post. They list Biden’s lead difference since the earlier survey was 7%. But the earlier poll had Biden with a 2% lead, and the later poll had him with a 5% lead, for a net difference of only 3%. And all the polls they identified are from the 538 website, the same site I used.
With differences this small it could easily be within the margin of error for both surveys. In other words, random error. So I decided to use a different method to decide if Biden’s lead is deteriorating.
As with the Times analysis, I collected polls from March 18 through June 3, a period which the Covid-19 virus was spreading, the economy collapsing and the killing of George Floyd and the ensuing protests. All polls were retrieved from the same 538 website.
To be sure I was comparing apples to apples, eighteen of the twenty polling firms were ranked by 538 as A or A+ and two a B+.These were national polls with the highest standards.
As in the Times article, all used live telephone interviews and national samples of 700 or more, the Gold Standard for surveys. Of the 20 firms, six were also included in the Times’ analysis.
With all 20 surveys, Biden had an lead of 5.1% over Trump. But this average difference does not tell us if Biden’s lead is expanding, declining or staying the same.
For comparison, I split the polls into two groups: Ten surveys were conducted from March 18 through April 15 and ten from April 29 through June 3. In the latter period, the killing of George Floyd took place, so we would expect Biden’s percent to increase. So my hypothesis is that the later surveys will show an increase in Biden’s numbers.
Biden’s early polls (March 15-April 15) his average lead over Trump was 4.9%. His later polls (April 29-June 3) averaged 5.4%, a 0.5% increase.
Below is a graph that visually represents Biden’s lead over Trump in all 20 surveys. The blue line represents the early polls and the red, the later ones.
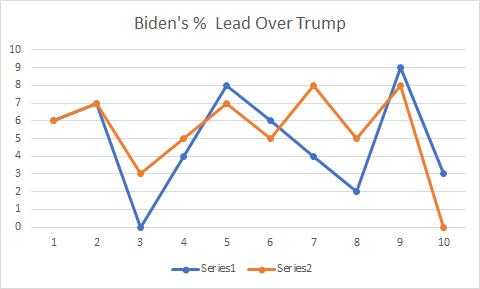
As you can see, there is a degree of variability during this three month period. Considering these are America’s finest polling firms using the exact “gold standard” survey methods, it may seem unusual. For me, after conducting hundreds of surveys, it does not.
As I taught my students at the University of Florida, polls are estimates and not a precise representation of all voters. Even the gold standard surveys, produce errors beyond the margin of error, such as wording and question order effects.
An easier representation of the polling data, is a graph comparing both Biden’s and Trump’s percentage from each of these same surveys, as shown below.
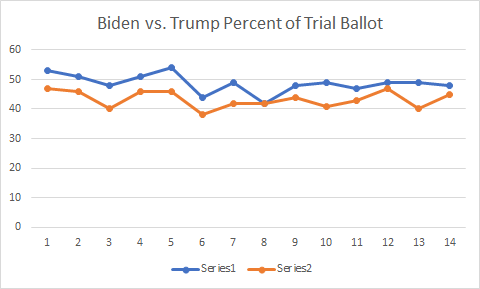
The blue line represents Biden’s percent of the two person vote and the red, Trump’s percent. The dates are the same as the previous chart, but interpretation is clearer. As you see, the variation is quite narrow with no significant spike for either candidate. The total difference for all 20 surveys is 5%, but spread over all surveys the average per poll difference is only 0.25%.
But is this lead a statistically significant difference? The best way to test this is with a statistical measure of the means (averages) between the two groups, the early polls and the later polls. The null hypothesis is that there is no statistical difference between the two periods.
I’ll use a statistical method called a paired T-test, which compares the means of the two groups. When applied to the two groups above, the significance level is .140 (T=-1.69), which is not significant and, consequently, the null hypothesis prevails and the differences are not statistically different. In plain terms, this tells us that there no difference between the two time periods.
Using the same type of polling methodology, our analysis does not confirm the New York Times’ analysis that at this time period Biden’s lead is eroding. In fact, the two candidates’ polling is remarkably stable considering the current political and economic environment.
At the national level, the Trump numbers have been upside down almost from the moment he took the oath. For the Trump campaign, what really matters is at the state level. Their plan is to again capture the Electoral Vote and let the national popular vote go its own way. I’ll be watching those states…