June 2, 2020
Conventional wisdom has always had Democrats benefiting from higher turnout. After all, Democrats have a larger proportion of lower income and less educated voters. Even the Republicans must believe this as well, since Republican legislatures often pass more restrictive rules to limit new registrants usually under the guise of preventing voter fraud.
Conventional wisdom, however, is not always right. In Florida, presidential election turnout in 2016 was 75% , which ranked 11th among all 50 states. Since 1954, the average presidential turnout was 74.5%.The average turnout consistency is remarkable considering the significant changes in population and demographics.
The question for me is, did the turnout help or hurt Clinton in the Florida 2016 election? In pursuit of this answer, I collected by each county’s turnout data the following four variables: Republican Percent, Democrat Percent, Turnout Percent, and Black Voter Percent. I have used a linear model and regressed these variables on Trump’s percent of the county vote.
Below are the model’s unstandardized coefficients and significance levels. All four variables are highly significant (Sig. column).
| Coefficients | ||||||
| Model | Unstandardized Coefficients | Standardized Coefficients | t | . | ||
| B | Std. Error | Beta | ||||
| 1 | (Constant) | -40.677 | 9.242 | Sig. | ||
| REPUB. PERCENT | 1.992 | .103 | 1.490 | 19.337 | .000 | |
| DEM. PERCENT | 1.270 | .120 | .966 | 10.560 | .000 | |
| TURN.PER. 2016 | -.310 | .138 | -.102 | -2.246 | .028 | |
| BLACK.PER | -.462 | .084 | -.319 | -5.535 | .000 |
The unstandardized coefficients (in red) shows the effect of each variable, while holding all other variables constant. For instance, since the dependent variable is the percent of Trump’s vote, and the coefficient for Republican percent is positive (1.992), his percent of the vote (mean) increases as more Republicans vote.
Below is scatter plot of the regression model’s predicted Trump percent, with an Rsq.=.902.
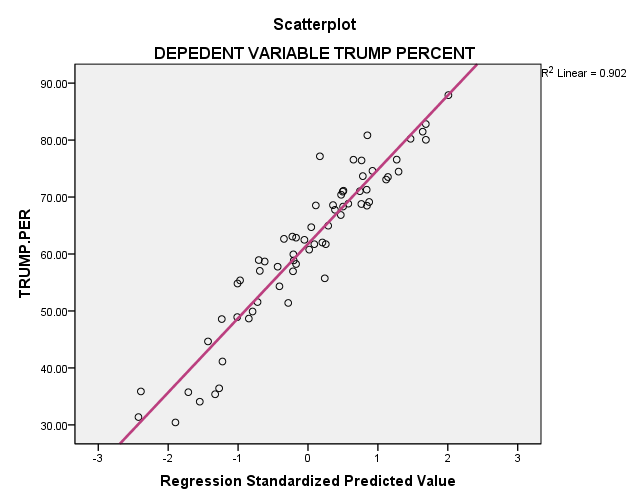
In this case, for every one percent increase in Republicans who vote, his (Trump’s) mean percent of the total vote increases by 1.992%, while holding all other variables constant. This property of holding the other variables constant is crucial because it allows you to assess the effect of each variable in isolation from the others.
On the other hand, as the percent of Black voters increase, Trump’s percent of the total vote decreases since it has a negative sign. The same is true of turnout, since it is also negative. So in 2016, the common wisdom that higher turnout benefits the Democrats is true, at least in the 2016 election.
The -.310 means that a one percent increase in turnout reduces Trump’s percent by a negative .310%. So an increase in turnout by 10% reduces his vote by 3.1%. See how simple this is.
Now for the big surprise! An increase in the registered Democratic vote increases his percent of the total vote just like the Republican vote. In this case, a 10% increase in the Democratic vote increases his two party vote by 12.7%.
Now before you think I’m crazy or at least wrong, let me explain. First, this is Florida and the laws of physics or partisan voting don’t apply. In many counties, voters often vote for local Democratic candidates, but when it comes to statewide and national elections, they vote Republican.
Let’s look at a couple of counties as an example. In Calhoun County, the percent of registered Democrats is 52% but Hillary Clinton’s percent of the two party vote in 2016 election was only 20%. And how about Franklin County? Democratic registration is 47% and Republicans 38%. Clinton’s percent in the election was 28%. And so on..
All throughout the panhandle and central Florida rural counties, many registered Democrats voted for Donald J. Trump. And yes, larger urban counties did vote for Clinton. But in the end these small counties carried the day for Trump by a margin of 1.2%.
So does a higher turnout benefit the Democrats? The answer is yes when controlling for other variables. More importantly, the effect of higher turnout is dwarfed by the number of Democratic voters who voted for Trump, increasing his percent of the vote by over 12%.
With a difference of a only 1.2%, if you are a Democratic candidate it might be time to spend a little more time and money in these smaller counties. In 2012, Barack Obama beat Clinton’s total Florida vote by 4.4%, mainly on the small counties where he bested her vote by 5.3%.
So the road map for victory for Democrats is through the smaller counties. Start in Wakulla County and take the Swanee river south until you hit the Withlacoochee river. From there pick up the Kisssimmee to Lake Okeechobee and jump on the Ocklawaha River heading west. There aren’t many voters along there, but you when your finished the trip you’ll understand why Hillary Clinton lost Florida. Be safe…