May 26, 2020
Regular viewers of this site may recall that one of my original posts was showing our Covid-19 model for both Florida and the US. The model was a non-linear (cubic) estimate of the direction of the virus that accurately predicted when the virus’s new cases began to decline in both Florida and the Nation.
Unfortunately, as the data points descended, they slowed down and eventually began backing up, causing a traffic jam of data points. New Covid-19 cases would on one day go down and the next go back up and so on and on. In addition, the up and down changes weren’t uniform.
To correct for this up and down pattern, I went to my old calculus tool box and applied a logarithmic data transformation called a natural log (ln). In this case, the transformation is from daily new cases to percentage change. So instead of watching cases move up an down we now plot the percent change from each data point. In addition, this log transformation makes the data far more interpretable.
Using a polynomial equation (cubic), I can now attempt to predict the direction of Florida’s new Covid cases by using the transformed (ln) data. I want to emphasize that this effort is experimental and could easily predict nothing except that I was wrong, but in theory it should work. The chart below plots the expected path.
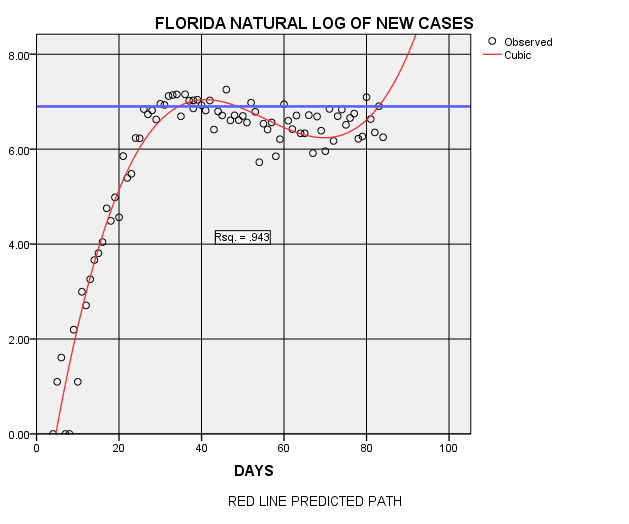
The red line shows the predictive path of new cases. The small circles show the actual cases after transformed into percentage change. The blue lateral line shows the flattened ceiling of the data.
For example, the virus percentage change peaked around the 37th day and began to decline until about the 70th day when the cases (percentage change) began to rise again.
From that point, the red line bends upward. This is the model’s predicted path, which suggests a rise in new cases. In other words, the Florida Covid-19 pandemic is increasing and no longer stabilized! If this trend is correct, it strongly suggests that the loosening of restrictions has allowed the virus to expand.
I will post this graph on a regular basis or when significant changes occur. I have mixed emotions about the success of this experiment. Like all of us, I want this virus to disappear sooner than later. It is very possible that the prediction line will shift downward and show a decline in new cases. For me, that’s a win-win. Be safe in any case…