May 5, 2020
Below are the latest models for both the US and Florida. With many states opening up and reducing social distancing guidelines, many experts worry that the number of new cases (and eventually deaths) will rise or even spike. But for now, the impact of these changes have had no effect on our models.
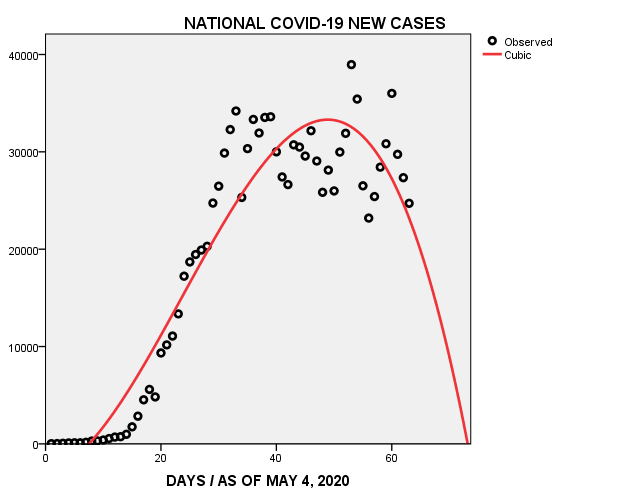
The predicted national trend line continues on a downward direction. The end point, however, has been pushed back another 15 days.
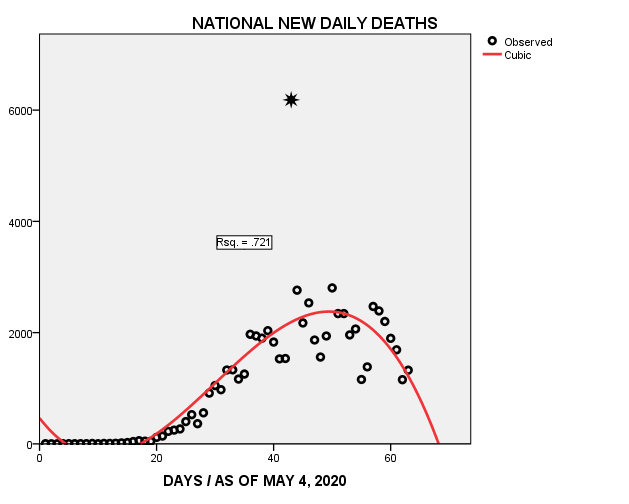
As for the daily deaths, the predicted trend line is still dropping as well. In the month of March alone, Covid-19 has claimed the lives of 68,157 Americans. The University of Washington’s latest model has predicted a significant increase in total deaths (doubling the previous estimate).
This is not a surprise since the previous model had substantially underestimated the number of deaths in its last report. At this point, our model doesn’t reflect this increase, at least not yet. You may have noticed a “star” in the upper center of the graph. This aberration is likely a “data dump” caused by previously missed cases being dropped arbitrarily on one day. In other words, it’s an aberrant data point and should be ignored since no one can explain what it represents.
Florida’s new cases model continues its predicted track but at a painfully slow and erratic pace. The latest four data points shows a pattern of one lower followed by one slightly higher.
+
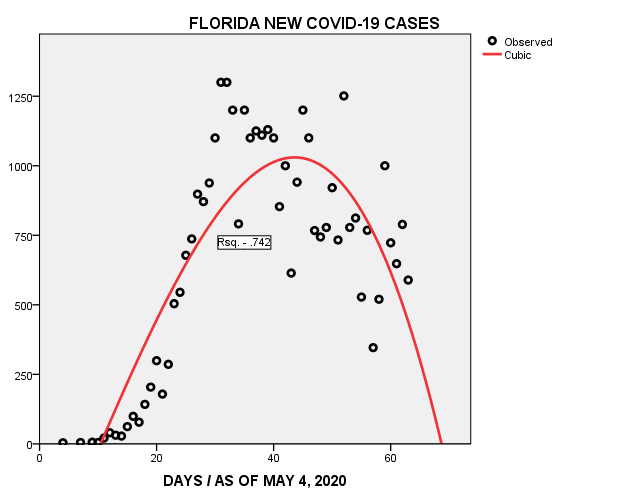
But the total of new cases, continues to show a decline. For example, the daily average of the last 15 new cases is 681. The previous 15 days, however, had an average daily rate of 1751 new cases, an average drop of 1070 cases.
These daily new case counts will provide our canary in the coal mine variable for future models. If the national and/or state data points start to increase beyond the model’s expectations, it will signal that the relaxation of social distancing is not working. Look for updates on a regular basis. Be safe…