April 13, 2020
Mark this date down on your calendar, it’s the day we started toward normality. Our latest model shows that Florida has peaked and begun the long trek downward to no new virus cases, as shown in Chart 1 below.
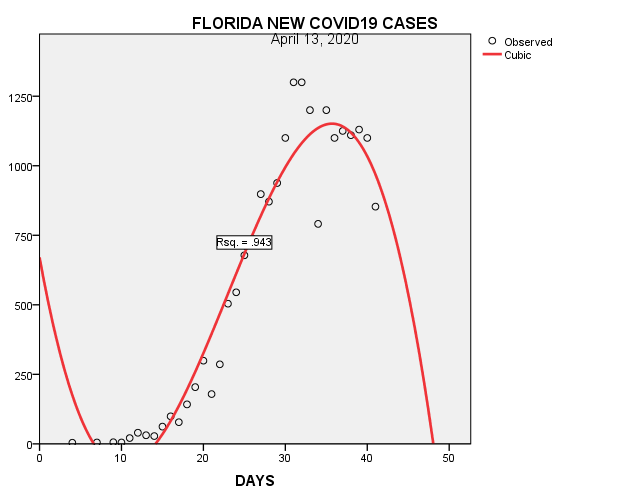
Notice at just past the peak of the curve (red line) there is a cluster of cases on the early downside. This is an early sign of q decline in new cases. There are of couple of outliers, but they are new cases that are even lower than the cluster cases. All point toward the beginning of fewer cases.
That doesn’t we mean are out of the woods yet. There still could be few bumps along the way, but it all points to a downward trend. That is, if we continue social distancing.
There is a similar pattern developing at the national level as well, although slightly behind Florida, as shown in Chart 2 below.
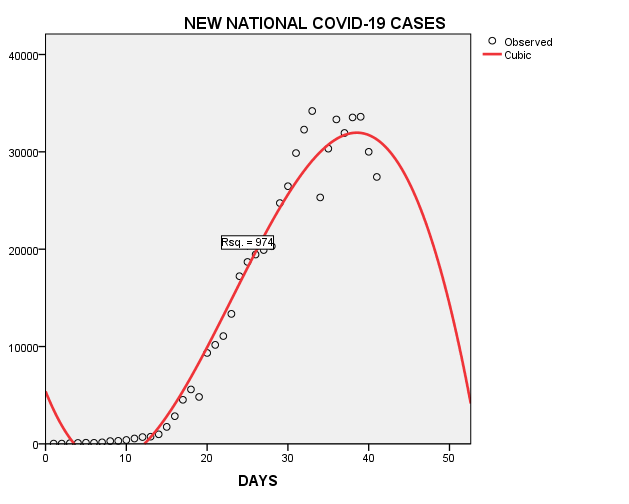
There is a clear peak here as well and the beginning of lower data points (new cases). Like the Florida model, the red trend line predicts a steady decline in new cases.
Although this very good news, it’s the just the beginning. of long process to normalcy. Stay at home and wear a mask when out, or you still end up on the chart below: Covid-19 daily deaths.
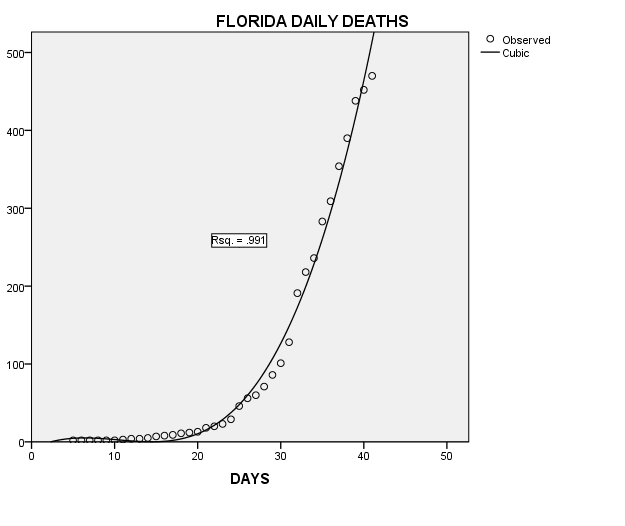
Unfortunately, the number of Florida daily Covid-19 deaths continue to climb. As I have mentioned in previous posts, the time lag between new deaths and new cases is approximately 13 to 18 days from infection. Deaths will likely continue to rise until there is a significant decline in new cases over a few weeks.
The same is true for the national virus epidemic as well, as demonstrated in the model’s estimate below.
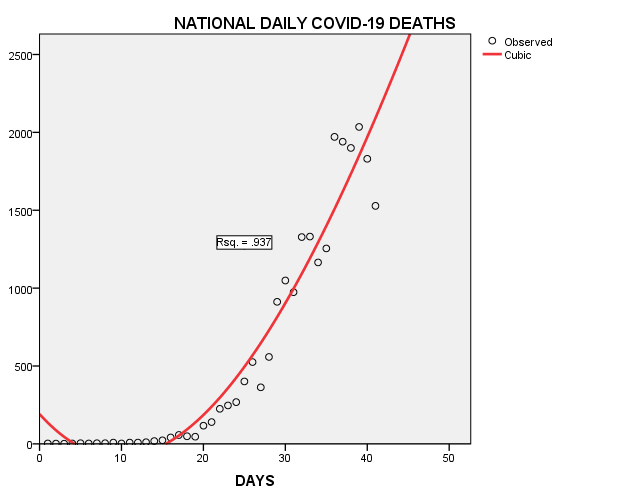
National daily deaths, continue to climb as well, but unlike Florida, there are some early signs of slowing down, which is surprising. Yesterday, some 1528 deaths in the US. The day before, there were 1830 deaths recorded. This could be just a random event, but the next few days will confirm or reject this early trend. I will keep watching it….
What is the Doctor Politics Coronavirus Model
The basis for using a polynomial model is that the data you are exploring is non-linear. Meaning that one data point is not a linear relationship to another data point. In the case of new virus cases, we would not expect the number of new cases to move solely in a straight line. Our expectation (hypothesis) is that as the number of new cases increases, it will likely hit a plateau and eventually slow down and then decline, making curve at the top as it progresses.
This assumption requires a curvilinear model to track that change. This requires a method that follows the “curves.” Normally a quadratic regression model would be used, but that model only allows for data that curves in one direction and in a U or convex pattern. In the case of a virus, the data could wander in both directions (convex and concave).
The best method for this type of data is called a cubic regression model, which allows for data that can curve in both directions (convex/concave) and it uses three cubed predictors.
In the simplest of terms, the model can track the non-linear virus data points (a curve), and use that movement to predict the virus’s likely future path. Cubic regression has been used to explore complex DNA changes and in sophisticated stock market models.