August 7, 2020
It wasn’t that long ago when Republicans and Democrats generally agreed on when a woman could obtain an abortion. Like most issues in the U.S., politics made us reconsider the issue in a partisan way.
In the 1972 presidential election, Richard Nixon saw a potential way to attract Catholic votes. At that point in our history, Catholics were the most anti-abortion group. So he began a campaign strategy to take anti-abortion positions to attract them and also social conservatives.
In the 1972, Nixon won the election and carried a majority of Catholics. With that success, Republican strategists began to apply this strategy to Congressional races, using coalitions of evangelic voters around the abortion issue.
At this point, both Republican and Democratic rank and file voters we in near agreement on when an abortion should be legal. As an example, from 1977 though 1985, with the exception of 1978 and 1985 were they tied, more Republicans supported an “abortion for any reason” than Democrats, as shown below.
| YEAR | DEM % YES | REP % YES |
| 1977 | 32.9 | 39 |
| 1978 | 30.8 | 30 |
| 1980 | 37.3 | 38.6 |
| 1982 | 35.2 | 37.9 |
| 1983 | 26.6 | 35.5 |
| 1984 | 31.8 | 37.2 |
| 1985 | 33.8 | 33.4 |
But the tide turned at the end of Ronald Reagan’s second term. In the 1980 election campaign, Reagan made it a campaign promise to appoint anti-abortion judges. His position on abortion slowly seeped down into the rank and file beliefs, as shown in the table below, the percent of voters saying yes that a “woman should be able to have an abortion for any reason” declined among Republicans and increased with Democrats.
| YEAR | DEMOCRATS % YES | REPUBLICANS % YES |
| 1988 | 40 | 29.6 |
| 1989 | 41.2 | 32.8 |
| 1990 | 42.8 | 36.6 |
| 1991 | 42.1 | 41.3 |
| 1993 | 48.3 | 33.2 |
| 1994 | 47.2 | 38.8 |
| 1996 | 49.2 | 37.3 |
| 1998 | 43.3 | 27.7 |
| 2000 | 39.3 | 27.4 |
| 2002 | 45.4 | 28.5 |
| 2004 | 46.5 | 29.3 |
| 2006 | 48.5 | 27.7 |
| 2008 | 44.4 | 33.2 |
| 2010 | 49.9 | 31.3 |
| 2012 | 51.8 | 26.2 |
| 2014 | 53.6 | 29.5 |
| 2018 | 62.4 | 29.1 |
As you can see, the big change occurred in 1988, where Democrats overtook the Republicans in their support of woman’s right to have an abortion for any reason.
In the chart below, using the data from our table, you will see how the division between Democrats and Republican changed in an exponential way.
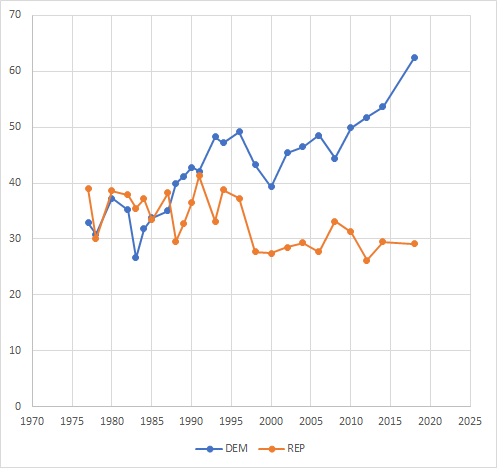
Blue line = Democrats / Red line = Republicans
In 1990, partisan voters went their separate ways. The Republican support has leveled off around 29%, while the Democrats have continued to increase their support for a woman’s right to have an abortion, with over 60% now supporting this view.
Are woman more pro-choice than men? You might expect a woman to be more pro-choice than a man but that assumption would be wrong. Using the most liberal of reasons for an abortion, that a woman should be able to decide an abortion for any reason, it turns out that both men and woman agree on this issue, as shown in the chart below.
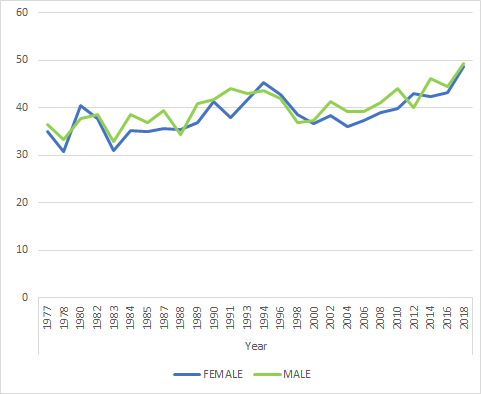
The two lines nearly strangle each other and the average difference is only 1.3%. Obviously, these men are married and know when to agree.
Women and Men Percent Yes on Abortion for any Reason
1977 – 1918
| women % Yes | men % Yes |
| 35 | 36.5 |
| 30.7 | 33.3 |
| 40.4 | 37.8 |
| 37.7 | 38.5 |
| 31 | 32.9 |
| 35.3 | 38.6 |
| 35 | 37 |
| 35.7 | 39.5 |
| 35.4 | 34.3 |
| 36.8 | 40.9 |
| 41.3 | 41.7 |
| 38 | 44.1 |
| 41.8 | 43 |
| 45.3 | 43.6 |
| 42.7 | 42 |
| 38.5 | 37 |
| 36.7 | 37.4 |
| 38.3 | 41.4 |
| 36.1 | 39.3 |
| 37.3 | 39.2 |
| 39.1 | 41.1 |
| 39.9 | 44.1 |
| 43.1 | 40.1 |
| 42.3 | 46.2 |
| 43.2 | 44.4 |
| 48.6 | 49.4 |
| 38.80 | 40.12 |
Donald Trump has carried on the Republican tradition of appealing to pro-life voters by announcing during the 2016 campaign that he would appoint only judges who would overturn Roe v. Wade. And so we are now back to the basic strategy started by Richard Nixon in 1972. Somethings never change…Be safe.