July 19, 2020
Probably most viewers of this blog keep an eye on the latest Biden vs. Trump poll numbers. That and Trump’s job approval ratings are the only metrics we can use to see who is winning and losing before the election itself.
But there is another measure of how well the candidates are doing and is possibly more accurate than polls (or what your neighbor believes).
But first I need to describe why this metric works. In 2004, James Surowiecki published a book entitled The Wisdom of Crowds: Why the Many Are Smarter Than the Few and How Collective Wisdom Shapes Business, Economies, Societies and Nations.
The book describes how the aggregation of information in groups increases prediction accuracy. As a real life example, he describes how a crowd at a county fair accurately guessed the weight of an ox when their individual guesses were averaged. The average of the guesses were significantly closer to the ox’s true butchered weight than the estimates of most crowd members.
His conclusion is that a diverse collection of independently deciding individuals is likely to make certain types of decisions and predictions better than individuals or even experts.
Although he doesn’t combine his insight with statistical sampling, the parallels are apparent. Surveys are, after all the aggregation of political opinions from a random selection of average voters.
The difference, of course, is that a traditional survey asks the voter who he or she will vote for and not who will win and by how much. Polls also become more accurate as the sample size increases (increasing the crowd). It is also the reason why combined polling averages can be more accurate than single poll as well.
In recent years, a number of prediction markets have appeared on the internet. These markets allow people to bet on the outcome of specific events such as elections. The concept of these markets is to allow people with or without expertise to make a bet on a specific event’s outcome, such as a presidential election.
The market prices indicate what the crowd thinks the probability of a certain event occurring. Market bets range from 0 to 100%, so the amount of the bet represents what betters expected probability that the event will occur. For example, if a person bets 62 cents a share on a certain candidate winning, that tells us that person believes that the odds of that candidate winning is 62%.
To test the viability of a prediction market, I will be reporting the market odds of Biden and Trump winning the November election. I have chosen a Predictit, a prediction market that specializes in political events such as presidential elections. Don’t worry, it’s completely legal because it’s a not-for-profit associated with a university.
On this site you can bet on not only the national presidential election, but also individual states as well. As of July 16th, the best national election offer for a Biden share was 63 cents. In market terms, that indicates a probability for Bidden winning at 63%. Donald Trump, on the other hand, the best offer for Trump is 39 cents per share or a 39% chance of winning.
The change in price for Bidden share since July 10th was only three cents (3%). For Trump his per share order has declined two cents (2%) in the same period. In other words, the market currently believes the odds of Biden winning is increasing and for Trump decreasing.
The rational of predictive markets is based on the economic theory of the efficient-market hypothesis, which states that prices reflect all available information. In other words, the market price includes all information that is necessary to make a predictable outcome.
In the case of a presidential election, that would obviously include polls, but also other information such as news reports, pundits on talk shows, the Covid pandemic and even friends and neighbors opinions.
The table below displays the battleground states and the corresponding share bets (cents) for each state. It also includes the current two month average of the latest poll results over the past two months.
| SHARE | SHARE | ||||
| STATE | BIDEN BET | TRUMP BET | BIDEN POLL% | TRUMP% | DIFF% |
| FLORIDA | 63 | 39 | 49.4 | 43.5 | 5.9 |
| PENN | 75 | 26 | 49 | 43.2 | 5.8 |
| WISCONSIN | 73 | 28 | 47.8 | 42.4 | 5.4 |
| OHIO | 46 | 56 | 47.7 | 44.7 | -3 |
| MICHIGAN | 75 | 26 | 49.2 | 42.1 | 7.1 |
| ARIZONA | 64 | 36 | 47.5 | 44.3 | 3.2 |
| NORTH CAROLINA | 58 | 42 | 47.6 | 45 | 2.6 |
| GEORGIA | 47 | 54 | 46 | 47.6 | -1.6 |
| IOWA | 44 | 57 | 46.2 | 47.9 | -1.7 |
| MINNESOTA | 83 | 20 | 52.3 | 41.3 | 11 |
Using Florida as an example, it shows that the current market bet on Biden winning is 63 cents a share. For Trump its 39 cents a share. In other words, the market believes the odds for Biden winning Florida is now 63%. At the same time, the latest polls show Biden with 49.4% and Trump at 43.5%, with Biden leading by 5.9%.
The data shows that market believes that Trump will only win three of the battleground states: Ohio, Georgia and Iowa. As you can see, their is also a consistency between the latest polling averages and the betters bets.
Why are people choosing on one candidate over another? To answer that, you have to remember that this is a for profit game, where winning is a financial gain and losing costs you money.
So the financial incentive should be paramount and not who you want to win. That should mean even Trump supporters could and are bidding on Biden, even if in their heart they would prefer the opposite outcome.
But that’s the very basis for the underlining wisdom of the crowd theory. It’s not who the better supports, but who he or she believes will win based on all available information.
The bidder calculus is based on the probabilities and the final payoff. Let me explain, if you bid 62 cents a share on Biden winning and he wins, your payoff is one dollar a share less the bid amount. Since you bid 62 cents, your net profit is 38 cents a share. If you bought a 1,000 shares, it cost you $620. Your profit is $380.
Now let’s say you think Trump can pull it out because the percent poll differences between the two candidates aren’t that great and he won that state in 2016. So instead of bidding on Biden, even though he is currently ahead, you buy 1,000 shares on Trump winning at a price of 32 cents a share for a total cost of $320. If he wins, your gross profit is a $1,000 less the $320 expense of purchase, for a net profit of $680, $300 more than the safer bet.
This scenario, however, only works if the bid price for a share is significantly lower than Biden’s, like the current bid price on Trump winning the national popular vote, which is currently at 38 cents a share. At the battleground state level, bid prices are usually higher due to their tendency to vote for both parties.
Do bidders use this scenario of bidding on the underdog to increase profits? Apparently they do when they think the polling differences aren’t that great or Trump is even leading.
Below is a regression graph showing how Trump bets per share in swing states increase as the poll differences decrease.
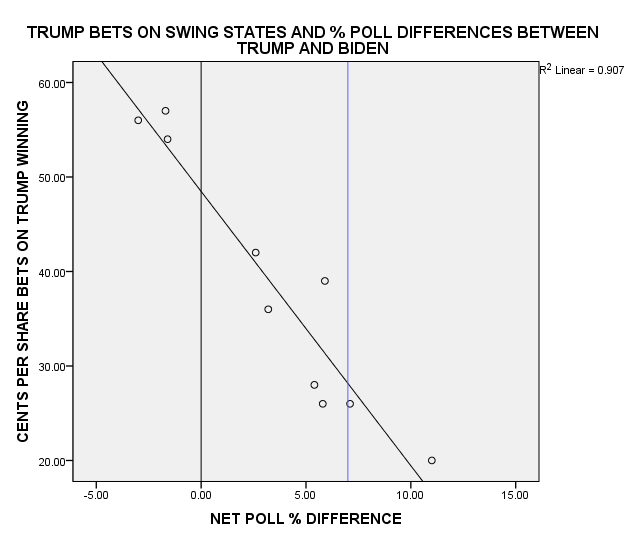
In the graph, the small circles are Trump bets on swing states. As the net percent polling difference increases in Biden’s favor (positive values), the number of Trump shares declines.
The sweet spot for Trump bets happen when the difference (% losing) is within the 3 and 7% difference in Biden’s favor. In that betting zone, is where the bulk of Trump bets occurred at prices they considered reasonable (25 cents to 42 cents a share).
Arizona is a good example. At this point, Biden leads Trump 3.2% and the best offer for Trump winning is 36 cents a share.
Although Arizona is suffering from a serious spike in new Covid-19 cases, the Republicans have won the last five presidential elections. The political website 270 to Win, has it as a toss up state. At 36 cents a share, for many betters this would be good buy, considering the potential payoff. (Now that I’m writing this, I’m considering buying a couple of Arizona Trump shares.)
When Trump is leading in the polls, some betters are willing to pay a premium for a share since they consider it a safer bet, such as in Georgia and Iowa, where Trump leads in the polls by 1.6% and 1.7% respectively. The current price is 54 cents and 57 cents a share.
Many of the Trump betters are using the strategy outlined in the national poll scenario, making bids less than 27 cents a share in a couple of cases when the polling percent differences are within 7%. If you win, your profits increase significantly.
Betting markets can provide us with another metric on who is winning and losing based on free market forces, but it doesn’t replace polls in my judgement. When all the votes are cast, I’ll evaluate how well it did compared to other methods.
In 2016, Predictit shares also predicted Hillary Clinton would win. The day before the November 7 election, the going bet was 81 cents a share she would win. A lot of people lost money that day…be safe.