May 24, 2020
I don’t know about you, but I’m having trouble of whether Florida’s new virus cases are rising, declining or just plain stuck in second gear. On television, some news stations tell us that Florida’s new cases are stabilized, and another reports it’s declining and and some newspapers that they are rising.
The problem is that in Florida the pattern of new cases is not obvious. Some days the state health department reports 1,200 new cases and the next day 650.That’s, of course, not their fault because this virus can’t decide if it’s coming or going. So the data pattern is often up and down each day.
Contributing to the problem is how most media outlets and the Health Department display the daily counts using the linear format of the ubiquitous bar chart like the one below.
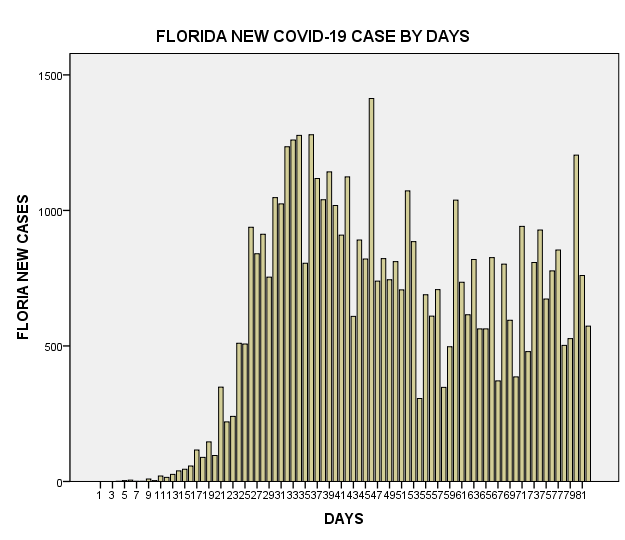
This bar chart tracks the actual daily number of cases since the first recorded cases in March. As you can see, the general pattern since the first peak around the 35th day, is downward until around the 40th day, when a series of up and down cases began to appear, interrupted only by occasional spikes.
Many times you will see a moving average line through the bars which is at least better than just the bars alone. The problem with moving averages, is how many days do you apply to make the average. Some use a seven-day average, or a three day or even a 30 day average. And besides smoothing the data, what does a moving average represent? How many days you apply effects the slope of the line and the more days used the flatter the line.
I have always opposed using linear graphs for data that isn’t linear. But the “up and down” pattern is hard for almost all graphic representations. The only way to solve this problem is to transform the data points into a form that moves in some systematic way and still accurately represents the data.
In calculus, log transformations are common in helping understand the data. In general, one of the main purposes of log transformations is to make the data better interpretable and graphs easier to understand.
Mathematicians, engineers and economists are the principal users of log transformations. For economists, the natural log (ln) is the preferred choice since it measures the percent change from data point to data point.
In other words, instead of raw data of new cases that go up and down, we can transform it into the percent change which can be graphed and understood. Below is a graph of the same data shown in the bar chart above, but with the data transformed into natural log (ln) values.
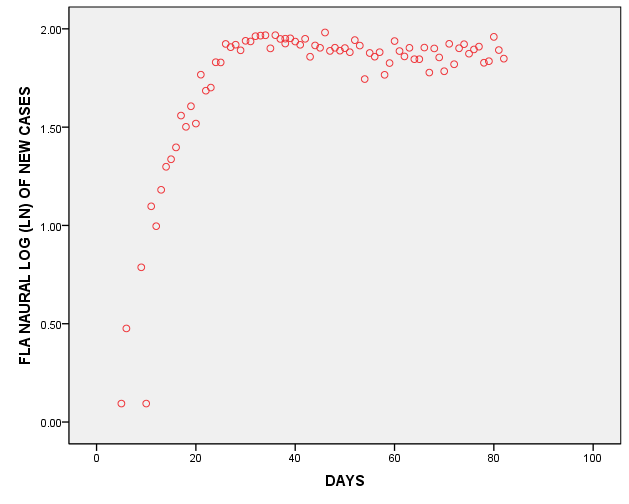
With the data transformed into percentage change, we can easily see that in the early days of the infections, the percentage change of new cases rose exponentially and then around the 30th day leveled off and has remained relatively flat since then.
You could interpret this chart as a good news-bad news story. The good news is that Florida’s new Covid cases have not continued to increase (as represented by percentage change). The bad news is that they haven’t declined yet either.
I will be using log transformations from time to time or when needed for you to understand graphs easier, without compromising the analysis. Some of my posts at times may be difficult to understand but feel free to ask me a question or leave me a comment and I will gladly reply. Be safe…